


Ch. 1 - Introduction to Statistics
Triola - Elementary Statistics 14th Edition
Triola14th EditionElementary StatisticsISBN: 9780137366446Not the one you use?Change textbook
Chapter 1, Problem 1.C.5

Determining Sample Size The given expression is used to determine the size of the sample necessary to estimate the proportion of college students who have the profound wisdom to take a statistics course. Find the value and round the result up to the next larger whole number.


[(1.95996)^2 - 0.25] / (0.03)^2

Verified step by step guidance
1
Identify the formula for determining the sample size for estimating a proportion, which is given by: \( n = \frac{Z^2 \cdot p \cdot (1-p)}{E^2} \), where \( Z \) is the Z-score, \( p \) is the estimated proportion, and \( E \) is the margin of error.
Recognize that the expression provided is a simplified version of the sample size formula, where \( Z = 1.95996 \), \( p = 0.5 \) (since \( 0.25 = 0.5 \times 0.5 \)), and \( E = 0.03 \).
Substitute the given values into the formula: \( n = \frac{(1.95996)^2 \cdot 0.5 \cdot 0.5}{(0.03)^2} \).
Calculate the numerator: \( (1.95996)^2 \cdot 0.5 \cdot 0.5 \).
Calculate the denominator: \( (0.03)^2 \), then divide the numerator by the denominator and round up to the next whole number to find the required sample size.

Verified video answer for a similar problem:

This video solution was recommended by our tutors as helpful for the problem above.
Video duration:
1m
Was this helpful?

Key Concepts

Here are the essential concepts you must grasp in order to answer the question correctly.

Sample Size Determination

Sample size determination is a statistical process used to calculate the number of observations or replicates needed in a study to achieve a desired level of precision. It ensures that the sample accurately reflects the population, minimizing errors and increasing the reliability of the results. In this context, it involves using a formula to estimate the proportion of a population with a specific characteristic.
Recommended video:
05:11
Sampling Distribution of Sample Proportion

Confidence Level and Z-Score

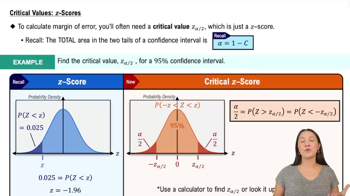
The confidence level represents the degree of certainty that the population parameter lies within the confidence interval. A Z-score is a statistical measurement that describes a value's relation to the mean of a group of values, often used in the context of confidence intervals. In the given expression, 1.95996 is the Z-score corresponding to a 95% confidence level, indicating the range within which the true population proportion is expected to fall.
Recommended video:
04:46
Critical Values: z Scores

Margin of Error

The margin of error is a statistic expressing the amount of random sampling error in a survey's results. It defines the range within which the true population parameter is expected to lie, with a certain level of confidence. In the formula, 0.03 represents the desired margin of error, indicating the acceptable range of deviation from the true proportion of students taking a statistics course.
Recommended video:
04:08
Finding the Minimum Sample Size Needed for a Confidence Interval
Related Practice
Textbook Question

Body Temperature The given expression is used for determining the likelihood that the average (mean) human body temperature is different from the value of 98.6°F that is commonly used. Find the given value and round the result to two decimal places.


(98.2 - 98.6) / (0.62 / sqrt(106) )

303
views
Textbook Question

Discrete/Continuous Data Which of the following describe discrete data?


a. The exact heights of all NBA basketball players

463
views
Textbook Question

IQ Scores Listed below are the IQ scores of randomly selected statistics professors. What value is obtained when those IQ scores are added and the total is divided by the number of scores? (This result, called the mean, is discussed in Chapter 3.) What is notable about these values?


135 149 145 129 118 119 115 133 107 188

240
views
Textbook Question

Birth Weights For 100 randomly selected births from Bellevue Hospital Center, the birth weights are added and then divided by 100. The result is 3240 g. Is the value of 3240 g a statistic or a parameter?

294
views
Textbook Question

Standard Deviation One way to get a very rough approximation of the value of a standard deviation of sample data is to find the range, then divide it by 4. The range is the difference between the highest sample value and the lowest sample value. In using this approach, what value is obtained from the sample data listed in Exercise 1 “IQ Scores”?

368
views
Textbook Question

Birth Weights Refer to the sample described in Exercise 6. Because Bellevue Hospital Center agreed to provide the 100 birth weights, does the sample of birth weights constitute a voluntary response sample?

253
views