Skip to main content
Statistics
My Course
Learn
Exam Prep
AI Tutor
Study Guides
Textbook Solutions
Flashcards
Explore
Try the app
My Course
Learn
Exam Prep
AI Tutor
Study Guides
Textbook Solutions
Flashcards
Explore
Try the app
Back
2. Describing Data with Tables and Graphs - Part 1 of 2!
Download worksheet
Problem 1
Problem 2
Problem 3
Problem 4
Problem 5
Problem 6
Problem 7
Problem 8
Problem 9
Problem 10
Problem 11
2. Describing Data with Tables and Graphs - Part 1 of 2!
Download worksheet
Practice
Summary
1 of 11
Next
2. Describing Data with Tables and Graphs / Visualizing Qualitative vs. Quantitative Data / Problem 1
Problem 1
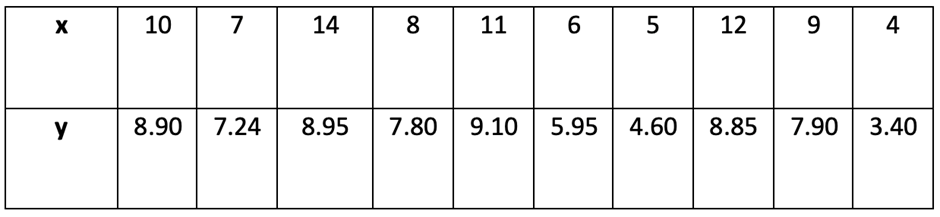
The following data set represents measurements of two related variables in an experiment.
Construct a scatterplot.
A
B
C
D
AI tutor
0
0 Comments
Show Answer
More options