Skip to main content
Statistics
My Course
Learn
Exam Prep
AI Tutor
Study Guides
Textbook Solutions
Flashcards
Explore
Try the app
My Course
Learn
Exam Prep
AI Tutor
Study Guides
Textbook Solutions
Flashcards
Explore
Try the app
Back
2. Describing Data with Tables and Graphs - Part 2 of 2!
Download worksheet
Problem 1
Problem 2
Problem 3
Problem 4
Problem 5
Problem 6
Problem 7
Problem 8
2. Describing Data with Tables and Graphs - Part 2 of 2!
Download worksheet
Practice
Summary
Previous
3 of 8
Next
2. Describing Data with Tables and Graphs / Dot Plots / Problem 3
Problem 3
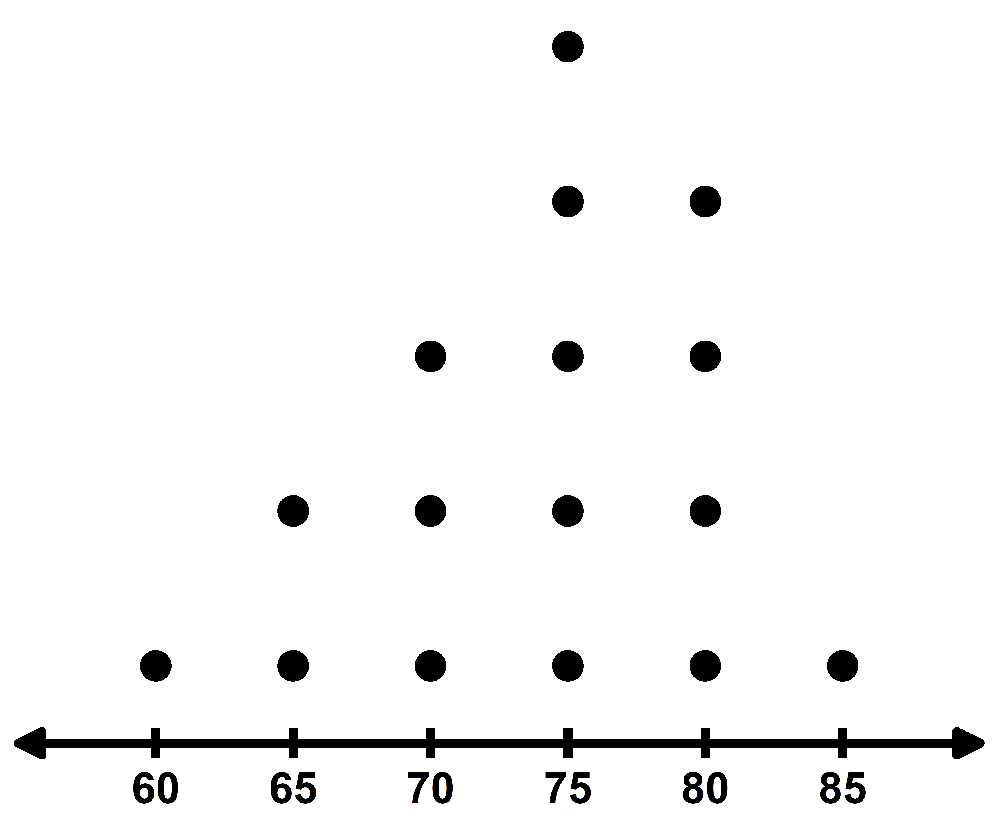
Based on the dot plot below, what is the maximum data value?
A
70
70
B
75
75
C
80
80
D
85
85
AI tutor
0
0 Comments
Show Answer
More options