2. Describing Data with Tables and Graphs - Part 2 of 2!
2. Describing Data with Tables and Graphs / Time-Series Graph / Problem 7
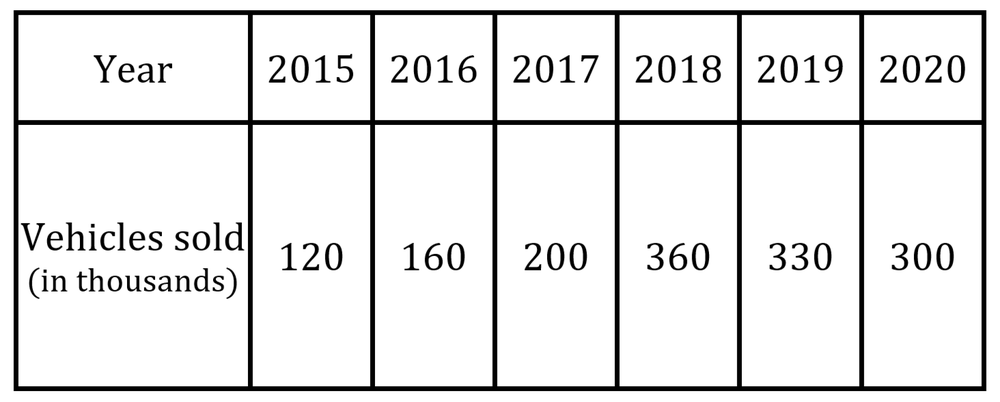
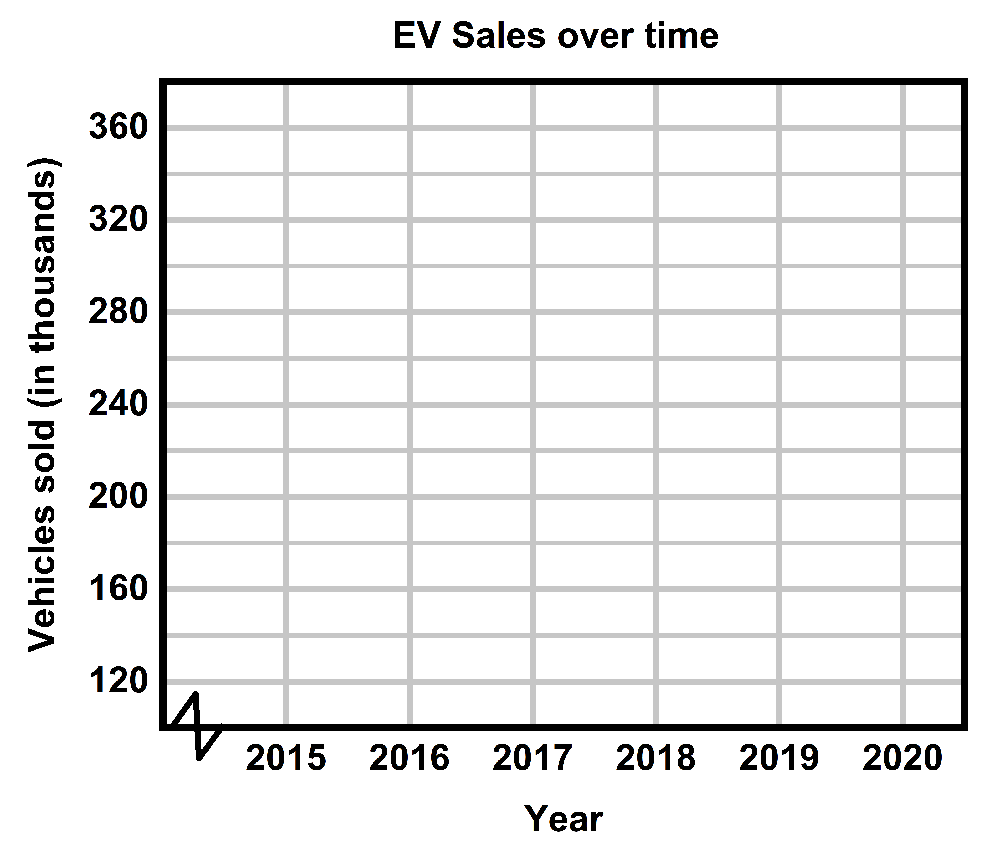
Problem 7
Use a time series chart to display the data shown in the table below. The data represents the number of electric vehicles (in units of thousands) sold from to .