3. Describing Data Numerically / Standard Deviation / Problem 8
Problem 8
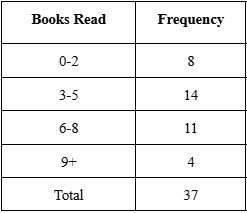
A college surveyed students about the number of books they read for leisure in a semester. The results are grouped as follows: Estimate the sample mean and sample standard deviation. Use as the midpoint for the ' books' group.