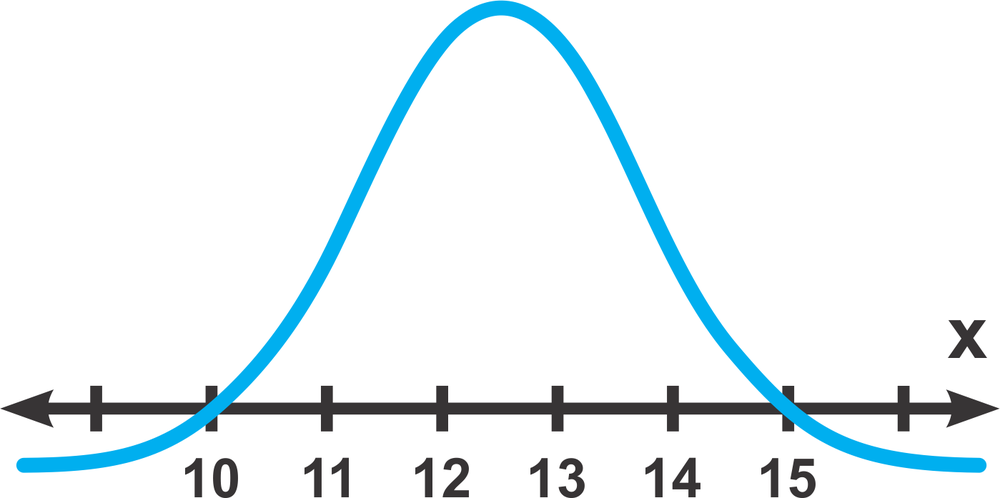
Standard Normal Distribution
6. Normal Distribution and Continuous Random Variables / Standard Normal Distribution / Problem 6
Problem 6

Could this graph represent a variable with a normal distribution? If so, estimate the mean and standard deviation. If not, explain your reasoning.
Graph of a normal distribution curve with x-axis values ranging from 10 to 15, illustrating mean and standard deviation concepts.