Skip to main content
Statistics
My Course
Learn
Exam Prep
AI Tutor
Study Guides
Textbook Solutions
Flashcards
Explore
Try the app
My Course
Learn
Exam Prep
AI Tutor
Study Guides
Textbook Solutions
Flashcards
Explore
Try the app
Back
Standard Normal Distribution
Download worksheet
Problem 1
Problem 2
Problem 3
Problem 4
Problem 5
Problem 6
Problem 7
Standard Normal Distribution
Download worksheet
Practice
Summary
Previous
2 of 7
Next
6. Normal Distribution and Continuous Random Variables / Standard Normal Distribution / Problem 2
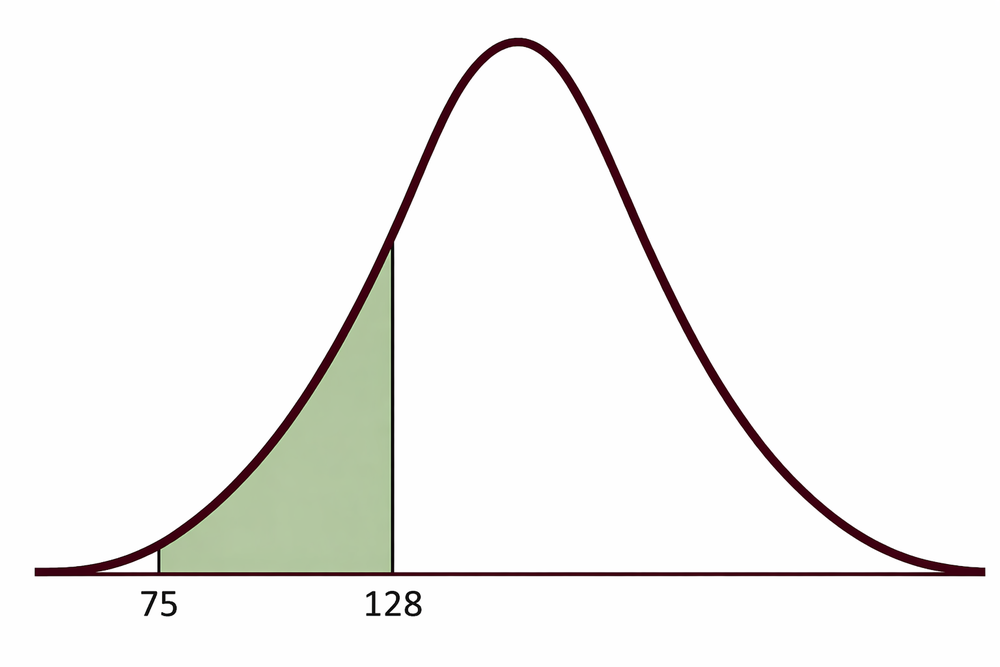
Problem 2
In a city, the monthly utility bills are normally distributed with a mean of
\(
150
\$150
and a standard deviation of
\)
20
\$20
. Find the area of the shaded region.
A
0.1536
0.1536
B
0.1587
0.1587
C
0.1356
0.1356
D
0.1357
0.1357
AI tutor
0
0 Comments
Show Answer
More options