Skip to main content
Statistics
My Course
Learn
Exam Prep
AI Tutor
Study Guides
Textbook Solutions
Flashcards
Explore
Try the app
My Course
Learn
Exam Prep
AI Tutor
Study Guides
Textbook Solutions
Flashcards
Explore
Try the app
Back
Sampling Distribution of the Sample Mean and Central Limit Theorem definitions
You can tap to flip the card.
Population Mean
You can tap to flip the card.
👆
Population Mean
Represents the average value for all members in a population, often denoted as mu, and is the target for statistical estimation.
Track progress
Control buttons has been changed to "navigation" mode.
1/15
Related flashcards
Related practice
Recommended videos
Sampling Distribution of the Sample Mean and Central Limit Theorem quiz #1
Sampling Distribution of the Sample Mean and Central Limit Theorem
10 Terms
7. Sampling Distributions & Confidence Intervals: Mean
2 topics
6 problems
Chapter
Ally
02:33
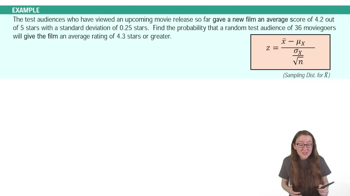
Central Limit Theorem Example 1
1352
views
50
rank
1
comments
05:14
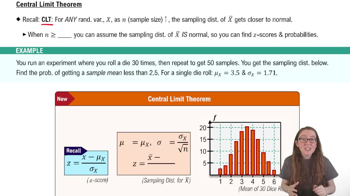
Central Limit Theorem
2040
views
26
rank
1
comments
06:53
Sampling Distribution of Sample Mean
3229
views
61
rank
Terms in this set (15)
Hide definitions
Population Mean
Represents the average value for all members in a population, often denoted as mu, and is the target for statistical estimation.
Sample Mean
Calculated by averaging values from a random sample; used to approximate the population mean but can vary between samples.
Random Sample
A subset of a population selected so each member has an equal chance of inclusion, ensuring unbiased representation.
Sampling Distribution
A frequency distribution formed by collecting multiple sample means from samples of the same size, revealing their variability.
Central Limit Theorem
States that as sample size increases, the sampling distribution of the sample mean approaches a normal distribution, regardless of population shape.
Normal Distribution
A symmetric, bell-shaped curve where most values cluster around the mean, allowing for probability calculations using z-scores.
Sample Size
The number of observations in each sample; larger sizes yield more reliable estimates and a more normal sampling distribution.
Z Score
A standardized value indicating how many standard deviations a statistic is from the mean, used for probability calculations.
Probability
A measure of how likely an event or outcome is, often calculated using the normal distribution and z-scores in sampling contexts.
Standard Deviation
Quantifies the spread of values in a dataset; in sampling distributions, it decreases as sample size increases.
Histogram
A graphical representation of a distribution, showing the frequency of sample means within intervals.
Bell Curve
A visual shape of the normal distribution, characterized by a peak at the mean and symmetric tails.
Population Standard Deviation
Measures variability among all members of a population, denoted as sigma, and used in sampling calculations.
Sampling Distribution Mean
The average of all sample means in a sampling distribution, which equals the population mean under the central limit theorem.
Z Table
A reference chart listing probabilities associated with z scores, used to interpret results from normal distributions.
 BackBack
 02:33
02:33