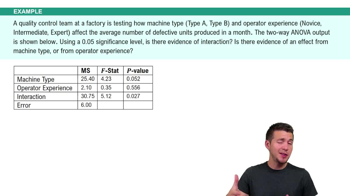
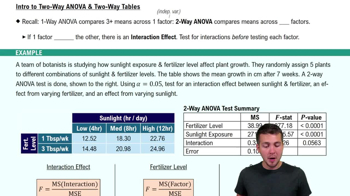
Statistical method comparing three or more means across two factors, allowing assessment of their combined and individual effects on a dependent variable.
Factor
Categorical variable whose levels are tested for their influence on a measured outcome, often arranged in rows or columns of a data table.
Dependent Variable
Measured outcome affected by the levels of two factors, typically displayed in the cells of a two-way ANOVA table.
Interaction Effect
Situation where the impact of one factor on the outcome depends on the level of the other factor, indicating non-independence.
Null Hypothesis
Default assumption stating no effect or no interaction between factors, guiding initial statistical testing.
Alternative Hypothesis
Statement proposing a difference or interaction exists between factors, considered when evidence contradicts the null.
F Statistic
Ratio of mean squares used to test hypotheses in ANOVA, calculated for each factor and interaction to assess significance.
Mean Square Error
Value representing unexplained variance in the data, used as the denominator in F statistic calculations.
Significance Level
Threshold, often 0.05, for deciding whether to reject the null hypothesis based on p-value comparisons.
P Value
Probability measure indicating the strength of evidence against the null hypothesis, compared to the significance level.
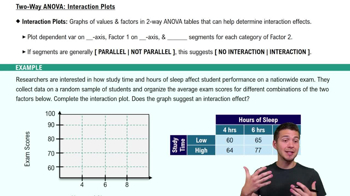
Interaction Plot
Graphical tool displaying the relationship between two factors and a dependent variable, used to visually assess interaction.
Parallelism
Feature in interaction plots where lines representing factor levels have similar slopes, suggesting no interaction effect.
Independent Factors
Condition where the effect of one factor does not depend on the level of the other, indicated by lack of interaction.
Category
Distinct level or group within a factor, such as low, medium, or high, used to organize data in ANOVA tables.
Alpha
Symbol representing the chosen significance level, guiding decisions on hypothesis rejection.
 Back
Back
 08:17
08:17