

Ch. 7 - Hypothesis Testing with One Sample
Larson - Elementary Statistics: Picturing the World 8th Edition
Larson8th EditionElementary Statistics: Picturing the WorldISBN: 9780137493470Not the one you use?Change textbook
Chapter 7, Problem 7.4.10b

Graphical Analysis In Exercises 9–12, state whether each standardized test statistic t allows you to reject the null hypothesis. Explain.


b. t = 1.42


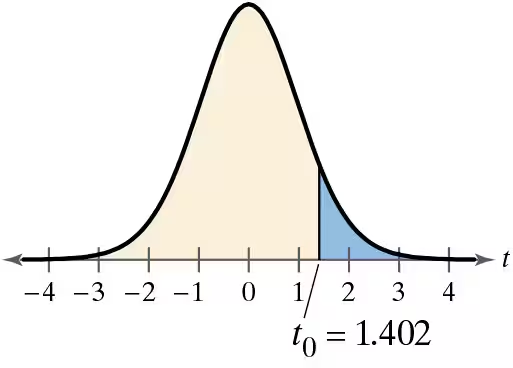
Graph of a t-distribution showing t0 = 1.402, with shaded areas indicating rejection regions for hypothesis testing.

Verified step by step guidance
1
Step 1: Understand the context of the problem. The standardized test statistic t = 1.42 is given, and we need to determine whether it allows us to reject the null hypothesis. This decision depends on the critical value and the significance level (α) of the test.
Step 2: Analyze the graph provided. The graph shows a t-distribution with the test statistic t₀ = 1.402 marked. The shaded region represents the area in the tail of the distribution, which corresponds to the p-value or the critical region.
Step 3: Compare the test statistic t₀ = 1.402 to the critical value. If the test statistic falls within the critical region (shaded area), we reject the null hypothesis. Otherwise, we fail to reject it. The critical value depends on the degrees of freedom and the significance level (α).
Step 4: Determine the significance level (α) and the corresponding critical value. If the graph or problem specifies α (e.g., 0.05), use a t-table or statistical software to find the critical value for the given degrees of freedom.
Step 5: Conclude based on the comparison. If t₀ = 1.402 is less than the critical value, the null hypothesis cannot be rejected. If t₀ is greater than the critical value, the null hypothesis is rejected. Ensure the interpretation aligns with the graph and the problem context.

Verified video answer for a similar problem:

This video solution was recommended by our tutors as helpful for the problem above.
Video duration:
1m
Was this helpful?

Key Concepts

Here are the essential concepts you must grasp in order to answer the question correctly.

Standardized Test Statistic (t)

A standardized test statistic, such as t, is used in hypothesis testing to determine how far a sample statistic is from the null hypothesis value, measured in standard errors. The t statistic is particularly useful when the sample size is small and the population standard deviation is unknown. It helps assess whether to reject the null hypothesis based on the calculated value and the critical values from the t-distribution.
Recommended video:
Guided course
06:34
Step 2: Calculate Test Statistic

Null Hypothesis (H0)

The null hypothesis (H0) is a statement that there is no effect or no difference, and it serves as the default assumption in hypothesis testing. Researchers aim to gather evidence against H0 to support an alternative hypothesis (H1). The decision to reject or fail to reject H0 is based on the comparison of the test statistic to critical values, which define the rejection region.
Recommended video:
Guided course
06:21
Step 1: Write Hypotheses

Rejection Region

The rejection region is the area in the tails of the probability distribution where, if the test statistic falls, the null hypothesis is rejected. This region is determined by the significance level (alpha), which is the probability of making a Type I error. In the context of the t-distribution, the rejection region is defined by critical t-values, and understanding its location helps in making decisions about the null hypothesis.
Recommended video:
Guided course
09:56
Step 4: State Conclusion
Related Practice
Textbook Question

Interpreting a Decision In Exercises 43–48, determine whether the claim represents the null hypothesis or the alternative hypothesis. If a hypothesis test is performed, how should you interpret a decision that


b. fails to reject the null hypothesis?


Marketing A fitness equipment company claims that its competitor’s home gym does not have a customer satisfaction rate of 99%.

42
views
Textbook Question

Graphical Analysis In Exercises 9–12, state whether each standardized test statistic t allows you to reject the null hypothesis. Explain.


b. t = 0

69
views
Textbook Question

Interpreting a Decision In Exercises 43–48, determine whether the claim represents the null hypothesis or the alternative hypothesis. If a hypothesis test is performed, how should you interpret a decision that


b. fails to reject the null hypothesis?


Rent A recent study claims that at least 20% of renters are behind on rent payments in New Jersey. 

54
views
Textbook Question

Interpreting a Decision In Exercises 43–48, determine whether the claim represents the null hypothesis or the alternative hypothesis. If a hypothesis test is performed, how should you interpret a decision that


b. fails to reject the null hypothesis?


Gas Mileage An automotive manufacturer claims that the standard deviation for the gas mileage of one of the vehicles it manufactures is 3.9 miles per gallon.

72
views
Textbook Question

Writing Hypotheses: Backpack Manufacturer A backpack manufacturer claims that the mean life of its competitor’s backpacks is less than 5 years. You are asked to perform a hypothesis test to test this claim. How would you write the null and alternative hypotheses when


b. you represent the competitor and want to reject the claim?

42
views
Textbook Question

Writing Hypotheses: Internet Provider An Internet provider is trying to gain advertising deals and claims that the mean time a customer spends online per day is greater than 28 minutes. You are asked to test this claim. How would you write the null and alternative hypotheses when


b. you represent a competing advertiser and want to reject the claim?

86
views