


Ch. 10 - Correlation and Regression
Triola - Elementary Statistics 14th Edition
Triola14th EditionElementary StatisticsISBN: 9780137366446Not the one you use?Change textbook
Chapter 10, Problem 10.4.17

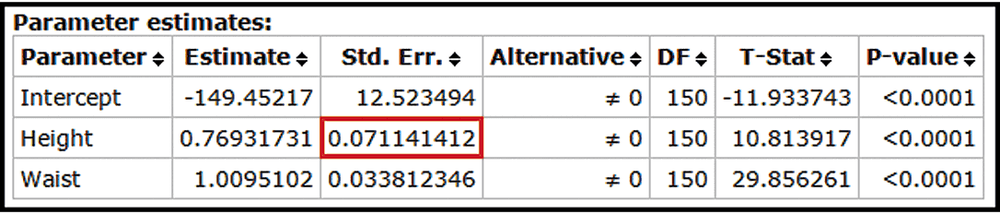
Testing Hypotheses About Regression Coefficients If the coefficient has a nonzero value, then it is helpful in predicting the value of the response variable. If it is not helpful in predicting the value of the response variable and can be eliminated from the regression equation. To test the claim that use the test statistic Critical values or P-values can be found using the t distribution with degrees of freedom, where k is the number of predictor variables and n is the number of observations in the sample. The standard error is often provided by software. For example, see the accompanying StatCrunch display for Example 1, which shows that (found in the column with the heading of “Std. Err.” and the row corresponding to the first predictor variable of height). Use the sample data in Data Set 1 “Body Data” and the StatCrunch display to test the claim that Also test the claim that What do the results imply about the regression equation?


<IMAGE>

Verified step by step guidance
1
Step 1: Identify the null and alternative hypotheses for the regression coefficients. For each predictor variable (Height and Waist), the null hypothesis (H0) states that the coefficient is equal to zero, meaning the variable is not helpful in predicting the response variable. The alternative hypothesis (H1) states that the coefficient is not equal to zero, meaning the variable is helpful in predicting the response variable.
Step 2: Locate the test statistic (T-Stat) and the corresponding P-value for each predictor variable from the StatCrunch display. For Height, the T-Stat is 10.813917 and the P-value is <0.0001. For Waist, the T-Stat is 29.856261 and the P-value is <0.0001.
Step 3: Compare the P-values to the significance level (typically α = 0.05). If the P-value is less than α, reject the null hypothesis (H0) for that predictor variable. Both Height and Waist have P-values <0.0001, which are less than 0.05, so the null hypotheses for both variables are rejected.
Step 4: Interpret the results. Since the null hypotheses are rejected for both Height and Waist, this implies that both variables are statistically significant and helpful in predicting the response variable. Their coefficients should be retained in the regression equation.
Step 5: Evaluate the regression equation. The results suggest that the regression equation, which includes the coefficients for Height and Waist, is effective in predicting the response variable. The statistical significance of these predictors supports their inclusion in the model.

Verified video answer for a similar problem:

This video solution was recommended by our tutors as helpful for the problem above.
Video duration:
3m
Was this helpful?

Key Concepts

Here are the essential concepts you must grasp in order to answer the question correctly.

Hypothesis Testing

Hypothesis testing is a statistical method used to make decisions about a population based on sample data. It involves formulating a null hypothesis (H0) and an alternative hypothesis (H1), then using a test statistic to determine whether to reject H0. In regression analysis, this often involves testing whether a regression coefficient is significantly different from zero, indicating its predictive power.
Recommended video:
Guided course
06:21
Step 1: Write Hypotheses

P-value

The P-value is a measure that helps determine the significance of results in hypothesis testing. It represents the probability of observing the test results, or something more extreme, assuming the null hypothesis is true. A low P-value (typically less than 0.05) suggests that the null hypothesis can be rejected, indicating that the predictor variable has a significant effect on the response variable.
Recommended video:
Guided course
06:50
Step 3: Get P-Value

Standard Error

The standard error (SE) quantifies the amount of variability or dispersion of a sample statistic, such as a regression coefficient. It is calculated as the standard deviation of the sampling distribution of the statistic. A smaller standard error indicates more precise estimates of the regression coefficients, which is crucial for determining the reliability of the hypothesis tests conducted on these coefficients.
Recommended video:
Guided course
08:45
Calculating Standard Deviation
Related Practice
Textbook Question

Interpreting a Graph The accompanying graph plots the numbers of points scored in each Super Bowl from the first Super Bowl in 1967 (coded as year 1) to the last Super Bowl at the time of this writing. The graph of the quadratic equation that best fits the data is also shown in red. What feature of the graph justifies the value of R^2 = 0.205 for the quadratic model?

153
views
Textbook Question

Sum of Squares Criterion In addition to the value of another measurement used to assess the quality of a model is the sum of squares of the residuals. Recall from Section 10-2 that a residual is (the difference between an observed y value and the value predicted from the model). Better models have smaller sums of squares. Refer to the U.S. population data in Table 10-7.

a. Find the sum of squares of the residuals resulting from the linear model.

187
views
Textbook Question

Finding the Best Model

In Exercises 5–16, construct a scatterplot and identify the mathematical model that best fits the given data. Assume that the model is to be used only for the scope of the given data, and consider only linear, quadratic, logarithmic, exponential, and power models.

Population Growth Here are the values of the world population (billions) beginning with the year 2000:

22
views
Textbook Question

Finding the Best Model

In Exercises 5–16, construct a scatterplot and identify the mathematical model that best fits the given data. Assume that the model is to be used only for the scope of the given data, and consider only linear, quadratic, logarithmic, exponential, and power models.

Earthquakes Listed below are earthquake depths (km) and magnitudes (Richter scale) of different earthquakes. Find the best model and then predict the magnitude for the last earthquake with a depth of 3.78 km. Is the predicted value close to the actual magnitude of 7.1?

24
views
Textbook Question

Garbage: Finding the Best Multiple Regression Equation

In Exercises 9–12, refer to the accompanying table, which was obtained by using the data from 62 households listed in Data Set 42 “Garbage Weight” in Appendix B. The response (y) variable is PLAS (weight of discarded plastic in pounds). The predictor (x) variables are METAL (weight of discarded metals in pounds), PAPER (weight of discarded paper in pounds), and GLASS (weight of discarded glass in pounds).

[IMAGE]

If exactly two predictor (x) variables are to be used to predict the weight of discarded plastic, which two variables should be chosen? Why?

172
views
Textbook Question

Interpreting R^2 For the multiple regression equation given in Exercise 1, we get R^2 = 0.897. What does that value tell us?

406
views