For courses in introductory statistics.
The Art and Science of Learning from Data
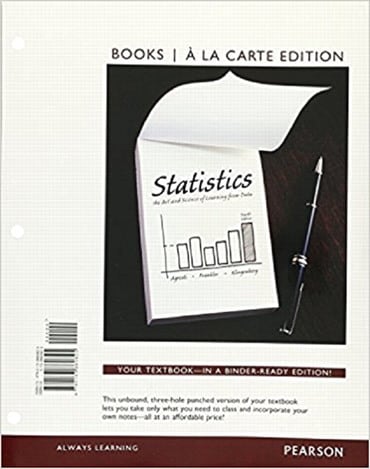
Statistics: The Art and Science of Learning from Data, Fourth Edition, takes a conceptual approach, helping students understand what statistics is about and learning the right questions to ask when analyzing data, rather than just memorizing procedures. This book takes the ideas that have turned statistics into a central science in modern life and makes them accessible, without compromising the necessary rigor. Students will enjoy reading this book, and will stay engaged with its wide variety of real-world data in the examples and exercises.
The authors believe that it’s important for students to learn and analyze both quantitative and categorical data. As a result, the text pays greater attention to the analysis of proportions than many other introductory statistics texts. Concepts are introduced first with categorical data, and then with quantitative data.
Also available with MyStatLab
MyStatLab™ is an online homework, tutorial, and assessment program designed to work with this text to engage students and improve results. Within its structured environment, students practice what they learn, test their understanding, and pursue a personalized study plan that helps them absorb course material and understand difficult concepts. For this edition, new web apps with complementary exercises, a tightly integrated video program, and strong exercise coverage enhance student learning.
Note: You are purchasing a standalone product; MyLab™ & Mastering™ does not come packaged with this content. Students, if interested in purchasing this title with MyLab & Mastering, ask your instructor for the correct package ISBN and Course ID. Instructors, contact your Pearson representative for more information.
If you would like to purchase boththe physical text and MyLab & Mastering, search for:
0134101677 / 9780134101675 * Statistics Plus New MyStatLab with Pearson eText -- Access Card Package
Package consists of:
0321847997 / 9780321847997 * My StatLab Glue-in Access Card
032184839X / 9780321848390 * MyStatLab Inside Sticker for Glue-In Packages
0321997832 / 9780321997838 * Statistics: The Art and Science of Learning from Data
Preface
PART ONE: GATHERING AND EXPLORING DATA
1. Statistics: The Art and Science of Learning from Data
1.1 Using Data to Answer Statistical Questions
1.2 Sample Versus Population
1.3 Using Calculators and Computers
Chapter Summary
Chapter Problems
2. Exploring Data with Graphs and Numerical Summaries
2.1 Different Types of Data
2.2 Graphical Summaries of Data
2.3 Measuring the Center of Quantitative Data
2.4 Measuring the Variability of Quantitative Data
2.5 Using Measures of Position to Describe Variability
2.6 Recognizing and Avoiding Misuses of Graphical Summaries
Chapter Summary
Chapter Problems
3. Association: Contingency, Correlation, and Regression
3.1 The Association Between Two Categorical Variables
3.2 The Association Between Two Quantitative Variables
3.3 Predicting the Outcome of a Variable
3.4 Cautions in Analyzing Associations
Chapter Summary
Chapter Problems
4. Gathering Data
4.1 Experimental and Observational Studies
4.2 Good and Poor Ways to Sample
4.3 Good and Poor Ways to Experiment
4.4 Other Ways to Conduct Experimental and Nonexperimental Studies
Chapter Summary
Chapter Problems
Part Review 1 (ONLINE)
PART TWO: PROBABILITY, PROBABILITY DISTRIBUTIONS, AND SAMPLING DISTRIBUTIONS
5. Probability in Our Daily Lives
5.1 How Probability Quantifies Randomness
5.2 Finding Probabilities
5.3 Conditional Probability
5.4 Applying the Probability Rules
Chapter Summary
Chapter Problems
6. Probability Distributions
6.1 Summarizing Possible Outcomes and Their Probabilities
6.2 Probabilities for Bell-Shaped Distributions
6.3 Probabilities When Each Observation Has Two Possible Outcomes
Chapter Summary
Chapter Problems
7. Sampling Distributions
7.1 How Sample Proportions Vary Around the Population Proportion
7.2 How Sample Means Vary Around the Population Mean
Chapter Summary
Chapter Problems
Part Review 2 (ONLINE)
PART THREE: INFERENTIAL STATISTICS
8. Statistical Inference: Confidence Intervals
8.1 Point and Interval Estimates of Population Parameters
8.2 Constructing a Confidence Interval to Estimate a Population Proportion
8.3 Constructing a Confidence Interval to Estimate a Population Mean
8.4 Choosing the Sample Size for a Study
8.5 Using Computers to Make New Estimation Methods Possible
Chapter Summary
Chapter Problems
9. Statistical Inference: Significance Tests About Hypotheses
9.1 Steps for Performing a Significance Test
9.2 Significance Tests About Proportions
9.3 Significance Tests About Means
9.4 Decisions and Types of Errors in Significance Tests
9.5 Limitations of Significance Tests
9.6 The Likelihood of a Type II Error
Chapter Summary
Chapter Problems
10. Comparing Two Groups
10.1 Categorical Response: Comparing Two Proportions
10.2 Quantitative Response: Comparing Two Means
10.3 Other Ways of Comparing Means and Comparing Proportions
10.4 Analyzing Dependent Samples
10.5 Adjusting for the Effects of Other Variables
Chapter Summary
Chapter Problems
Part Review 3 (ONLINE)
PART FOUR: ANALYZING ASSOCIATION AND EXTENDED STATISTICAL METHODS
11. Analyzing the Association Between Categorical Variables
11.1 Independence and Dependence (Association)
11.2 Testing Categorical Variables for Independence
11.3 Determining the Strength of the Association
11.4 Using Residuals to Reveal the Pattern of Association
11.5 Fisher’s Exact and Permutation Tests
Chapter Summary
Chapter Problems
12. Analyzing the Association Between Quantitative Variables: Regression Analysis
12.1 Modeling How Two Variables Are Related
12.2 Inference About Model Parameters and the Association
12.3 Describing the Strength of Association
12.4 How the Data Vary Around the Regression Line
12.5 Exponential Regression: A Model for Nonlinearity
Chapter Summary
Chapter Problems
13. Multiple Regression
13.1 Using Several Variables to Predict a Response
13.2 Extending the Correlation and R2 for Multiple Regression
13.3 Using Multiple Regression to Make Inferences
13.4 Checking a Regression Model Using Residual Plots
13.5 Regression and Categorical Predictors
13.6 Modeling a Categorical Response
Chapter Summary
Chapter Problems
14. Comparing Groups: Analysis of Variance Methods
14.1 One-Way ANOVA: Comparing Several Means
14.2 Estimating Differences in Groups for a Single Factor
14.3 Two-Way ANOVA
Chapter Summary
Chapter Problems
15. Nonparametric Statistics
15.1 Compare Two Groups by Ranking
15.2 Nonparametric Methods for Several Groups and for Matched Pairs
Chapter Summary
Chapter Problems
Part Review 4 (ONLINE)
Tables
Answers
Index
Index of Applications
Photo CreditsPearson offers special pricing when you package your text with other student resources. If you're interested in creating a cost-saving package for your students, contact your Pearson rep.
Alan Agresti is Distinguished Professor Emeritus in the Department of Statistics at the University of Florida. He taught statistics there for 38 years and developed three courses in statistical methods for social science students and three courses in categorical data analysis. He is author of over 100 refereed articles and five texts including Statistical Methods for the Social Sciences (with Barbara Finlay, Prentice Hall, 4th edition 2009) and Categorical Data Analysis (Wiley, 2nd edition 2002). He is a Fellow of the American Statistical Association and recipient of an Honorary Doctor of Science from De Montfort University in the UK. In 2003, Alan was named "Statistician of the Year" by the Chicago chapter of the American Statistical Association and in 2004, he was the first honoree of the Herman Callaert Leadership Award in Biostatistical Education and Dissemination awarded by the University of Limburgs, Belgium. He has held visiting positions at Harvard University, Boston University, London School of Economics, and Imperial College and has taught courses or short courses for universities and companies in about 30 countries worldwide. Alan has also received teaching awards from the University of Florida and an excellence in writing award from John Wiley & Sons.
Christine (Chris) Franklin is the K-12 Statistics Ambassador for the American Statistical Association and an elected ASA Fellow. She is retired from the University of Georgia as the Lothar Tresp Honoratus Honors Professor and Senior Lecturer Emerita in Statistics. She is the co-author of an Introductory Statistics textbook for post secondary, co-author for a sports statistics textbook for high school, and has published more than 60 journal articles and book chapters. Chris was the lead writer for the groundbreaking document of the American Statistical Association Pre-K-12 Guidelines for the Assessment and Instruction in Statistics Education (GAISE) Framework and chaired the writing team of the ASA Statistical Education of Teachers (SET) report. She is a past Chief Reader for Advance Placement Statistics, a Fulbright scholar to New Zealand (2015), recipient of the United States Conference on Teaching Statistics (USCOTS) Lifetime Achievement Award, the prestigious ASA Founder’s award and an elected member of the International Statistical Institute (ISI). Chris loves running, hiking, scoring baseball games, and reading mysteries.
Bernhard Klingenberg is Associate Professor of Statistics in the Department of Mathematics & Statistics at Williams College, where he has taught introductory and advanced statistics classes for more than 10 years. In 2013, Bernhard was instrumental in creating an undergraduate major in statistics at Williams, one of the first for a liberal arts college. At Williams, more than 70% of an incoming freshman class will have taken a course in introductory statistics by the time they graduate. A native of Austria, Bernhard frequently returns there to hold visiting positions at universities and gives short courses on categorical data analysis in Europe and the US. He has published several peer-reviewed articles in statistical journals and consults regularly with academia and industry. Bernhard enjoys photography (several of his pictures appear in this book), scuba diving, and spending time with his wife and four children.
We're sorry! We don't recognize your username or password. Please try again.
The work is protected by local and international copyright laws and is provided solely for the use of instructors in teaching their courses and assessing student learning.
You have successfully signed out and will be required to sign back in should you need to download more resources.