


Ch. 2 - Descriptive Statistics
Larson - Elementary Statistics: Picturing the World 8th Edition
Larson8th EditionElementary Statistics: Picturing the WorldISBN: 9780137493470Not the one you use?Change textbook
Chapter 2, Problem 2.4.11a

Archaeology The depths (in inches) at which 10 artifacts are found are listed. 
20.7 24.8 30.5 26.2 36.0 34.3 30.3 29.5 27.0 38.5


a. Find the range of the data set.

Verified step by step guidance
1
Step 1: Understand the concept of range. The range of a data set is the difference between the maximum value and the minimum value in the set. It provides a measure of the spread of the data.
Step 2: Identify the maximum value in the data set. Look at the given depths: 20.7, 24.8, 30.5, 26.2, 36.0, 34.3, 30.3, 29.5, 27.0, 38.5. The maximum value is the largest number in this list.
Step 3: Identify the minimum value in the data set. Similarly, find the smallest number in the list of depths provided.
Step 4: Subtract the minimum value from the maximum value. Use the formula: Range=Maximum-Minimum.
Step 5: The result of this subtraction will give you the range of the data set. Ensure the units (inches) are included in the final interpretation of the range.

Verified video answer for a similar problem:

This video solution was recommended by our tutors as helpful for the problem above.
Video duration:
1m
Was this helpful?

Key Concepts

Here are the essential concepts you must grasp in order to answer the question correctly.

Range

The range is a measure of dispersion that indicates the difference between the maximum and minimum values in a data set. It provides a simple way to understand the spread of the data. To calculate the range, subtract the smallest value from the largest value. In this case, it helps to summarize the variability in the depths at which the artifacts were found.
Recommended video:
Guided course
05:45
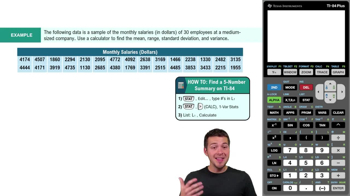
Find 5-Number Summary - TI-84 Calculator Example 1

Data Set

A data set is a collection of related values or observations that can be analyzed statistically. In this context, the data set consists of the depths at which the 10 artifacts were discovered. Understanding the structure of the data set is crucial for performing calculations like the range and for interpreting the results meaningfully.
Recommended video:
Guided course
04:39
Visualizing Qualitative vs. Quantitative Data

Descriptive Statistics

Descriptive statistics are statistical methods that summarize and describe the main features of a data set. This includes measures such as mean, median, mode, and range. These statistics provide insights into the central tendency and variability of the data, making it easier to understand the overall pattern and characteristics of the artifacts' depths.
Recommended video:
Guided course
05:53
Parameters vs. Statistics
Related Practice
Textbook Question

Using the Empirical Rule In Exercises 29–34, use the Empirical Rule.


Use the sample statistics from Exercise 29 and assume the number of vehicles in the sample is 75.


a. Estimate the number of vehicles whose speeds are between 63 miles per hour and 71 miles per hour.

320
views
Textbook Question

Protein Powder During a quality assurance check, the actual contents (in grams) of six containers of protein powder were recorded as 1525, 1526, 1502, 1516, 1529, and 1511.


a. Find the mean and the median of the contents.

100
views
Textbook Question

Pearson’s Index of Skewness The English statistician Karl Pearson (1857–1936) introduced a formula for the skewness of a distribution.

P = 3 (x̄ - median) / s

Most distributions have an index of skewness between -3 and 3. When P > 0, the data are skewed right. When P < 0, the data are skewed left. When P = 0, the data are symmetric. Calculate the coefficient of skewness for each distribution. Describe the shape of each.


a. x̄ = 17, s = 2.3, median = 19

145
views
Textbook Question

Extending Concepts


Data Analysis Students in an experimental psychology class did research on depression as a sign of stress. A test was administered to a sample of 30 students. The scores are shown in the table at the left.


" style="" width="275">


a. Find the mean and the median of the data.

90
views
Textbook Question

Shifting Data Sample annual salaries (in thousands of dollars) for employees at a company are listed.

40   35   49   53   38   39   40

37   49   34   38   43   47   35


a. Find the sample mean and the sample standard deviation.

63
views
Textbook Question

Drawing a Box-and-Whisker Plot In Exercises 15–18,

(a) find the five-number summary


4 7 7 5 2 9 7 6 8 5 8 4 1 5 2 8 7 6 6 9

147
views