

Ch. 3 - Probability
Larson - Elementary Statistics: Picturing the World 8th Edition
Larson8th EditionElementary Statistics: Picturing the WorldISBN: 9780137493470Not the one you use?Change textbook
Chapter 3, Problem 3.3.25b

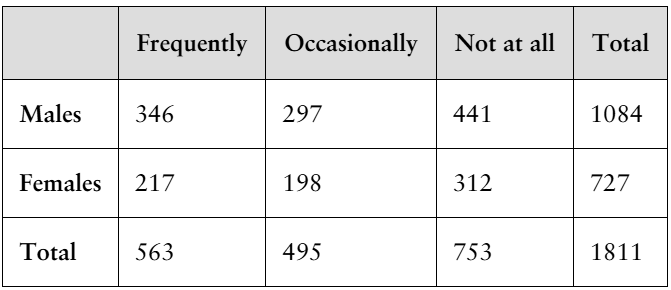
25. Working from Home The table shows the results of a survey that asked 1811 people how often they work from home. A person is selected at random from the sample. Find the probability of each event.
b. The person is female or does not work from home.
<IMAGE>

Verified step by step guidance
1
Step 1: Identify the total number of people surveyed, which is given as 1811. This will be the denominator for calculating probabilities.
Step 2: Determine the total number of females from the table. The total number of females is 727. This represents one part of the event 'female or does not work from home.'
Step 3: Determine the total number of people who do not work from home. From the table, the total number of people who do not work from home is 753. This represents the other part of the event 'female or does not work from home.'
Step 4: Use the formula for the probability of 'A or B' (union of two events): \( P(A \cup B) = P(A) + P(B) - P(A \cap B) \). Here, A is 'female' and B is 'does not work from home.'
Step 5: Calculate \( P(A \cap B) \), the probability of a person being female and not working from home. From the table, the number of females who do not work from home is 312. Use this value to adjust the union probability calculation.

Verified video answer for a similar problem:

This video solution was recommended by our tutors as helpful for the problem above.
Video duration:
4m
Was this helpful?

Key Concepts

Here are the essential concepts you must grasp in order to answer the question correctly.

Probability

Probability is a measure of the likelihood that an event will occur, expressed as a number between 0 and 1. In this context, it involves calculating the chance of selecting a person who is either female or does not work from home from the total sample. Understanding how to compute probabilities using the total number of favorable outcomes divided by the total number of possible outcomes is essential.
Recommended video:
5:37
Introduction to Probability

Union of Events

The union of events refers to the occurrence of at least one of the events in question. In this case, we are interested in the event where a person is either female or does not work from home. The probability of the union can be calculated using the formula P(A ∪ B) = P(A) + P(B) - P(A ∩ B), which accounts for any overlap between the two events.
Recommended video:
05:54
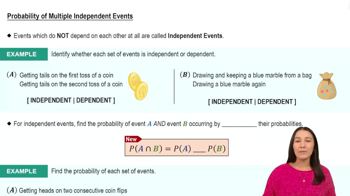
Probability of Multiple Independent Events

Complementary Events

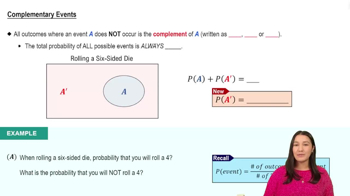
Complementary events are pairs of outcomes where one event occurs if and only if the other does not. In this scenario, understanding the complement of the event 'does not work from home' can simplify calculations. For instance, if we know the probability of working from home, we can easily find the probability of not working from home by subtracting from 1.
Recommended video:
4:23
Complementary Events
Related Practice
Textbook Question

"Using the Multiplication Rule In Exercises 19-32, use the Multiplication Rule.

25. Best President In a sample of 1500 adult U.S. citizens, 270 said that Barack Obama was the best president in U.S. history. Two adult U.S. citizens are selected at random.

(Adapted from YouGov)

b. Find the probability that neither adult U.S. citizen says that Barack Obama was the best president in U.S. history."

50
views
Textbook Question

"Using the Multiplication Rule In Exercises 19-32, use the Multiplication Rule.

27. Blood Types The probability that a person of Asian descent in the United States has type O+ blood is 39%. At random, six people of Asian descent in the United States are selected. (Source: American National Red Cross)

b. Find the probability that none of the six have type O+ blood."

54
views
Textbook Question

Politics The responses of 1500 U.S. adults to a survey that asked them to state their own political viewpoints are shown in the Pareto chart. Find the probability of each event.(Adapted from YouGov)

b. Randomly selecting a person from the sample who is conservative or very conservative

91
views
Textbook Question

2. Determine whether each number could represent the probability of an event. Explain your reasoning. b. 333.3%

161
views
Textbook Question

88. Individual Stock Price An individual stock is selected at random from the portfolio represented by the box-and-whisker plot shown. Find the probability that the stock price is between \$21 and \$50.

82
views
Textbook Question

Officers The offices of president, vice president, secretary, and treasurer for an environmental club will be filled from a pool of 14 candidates. Six of the candidates are members of the debate team.

b. What is the probability that none of the offices are filled by members of the debate team?

109
views