Skip to main content
Analytical Chemistry
My Course
Learn
Exam Prep
AI Tutor
Study Guides
Flashcards
Explore
Try the app
My Course
Learn
Exam Prep
AI Tutor
Study Guides
Flashcards
Explore
Try the app
Back
The End Point definitions
You can tap to flip the card.
Endpoint
You can tap to flip the card.
👆
Endpoint
Range in a titration where an indicator undergoes a noticeable color change, signaling a significant chemical change.
Track progress
Control buttons has been changed to "navigation" mode.
1/15
Related flashcards
Related practice
Recommended videos
The End Point quiz #1
The End Point
10 Terms
The End Point quiz
The End Point
15 Terms
The End Point
15. Redox Titrations
5 problems
Topic
Analyte Oxidation State
15. Redox Titrations
5 problems
Topic
15. Redox Titrations
4 topics
12 problems
Chapter
Guided course
07:27
The End Point
263
views
Terms in this set (15)
Hide definitions
Endpoint
Range in a titration where an indicator undergoes a noticeable color change, signaling a significant chemical change.
Equivalence Point
Stage in titration where stoichiometric amounts of reactants have completely reacted, often indicated by a sharp potential change.
Redox Indicator
Substance that changes color due to a shift in oxidation state, reflecting the solution's potential during a redox titration.
Titrant
Solution of known concentration added to react with the analyte, affecting the potential and causing indicator changes.
Analyte
Substance being analyzed in a titration, which reacts with the titrant and interacts with the indicator.
Oxidizing Agent
Species that removes electrons from another, often causing the indicator to shift to a higher oxidation state.
Reducing Agent
Species that donates electrons, typically causing the indicator to shift to a lower oxidation state.
Nernst Equation
Mathematical expression relating cell potential to the ratio of reduced and oxidized forms under non-standard conditions.
Transition Range
Potential interval where an indicator changes color, ideally overlapping the steepest part of the titration curve.
Titration Curve
Graph showing how solution potential or pH changes as titrant is added, highlighting sharp increases at key points.
First Derivative
Mathematical tool representing the rate of change in potential with respect to volume, used to pinpoint endpoints.
Gran Plot
Graphical method using the first derivative of potential versus volume to accurately identify the endpoint.
Oxidation State
Numerical value representing the electron count change of an atom, crucial for indicator color shifts in redox titrations.
Cell Potential
Electrical potential difference between two electrodes, influenced by the redox state and used to monitor titrations.
Color Change
Visible shift in indicator appearance, signaling a chemical transition such as oxidation or reduction during titration.
 BackBack
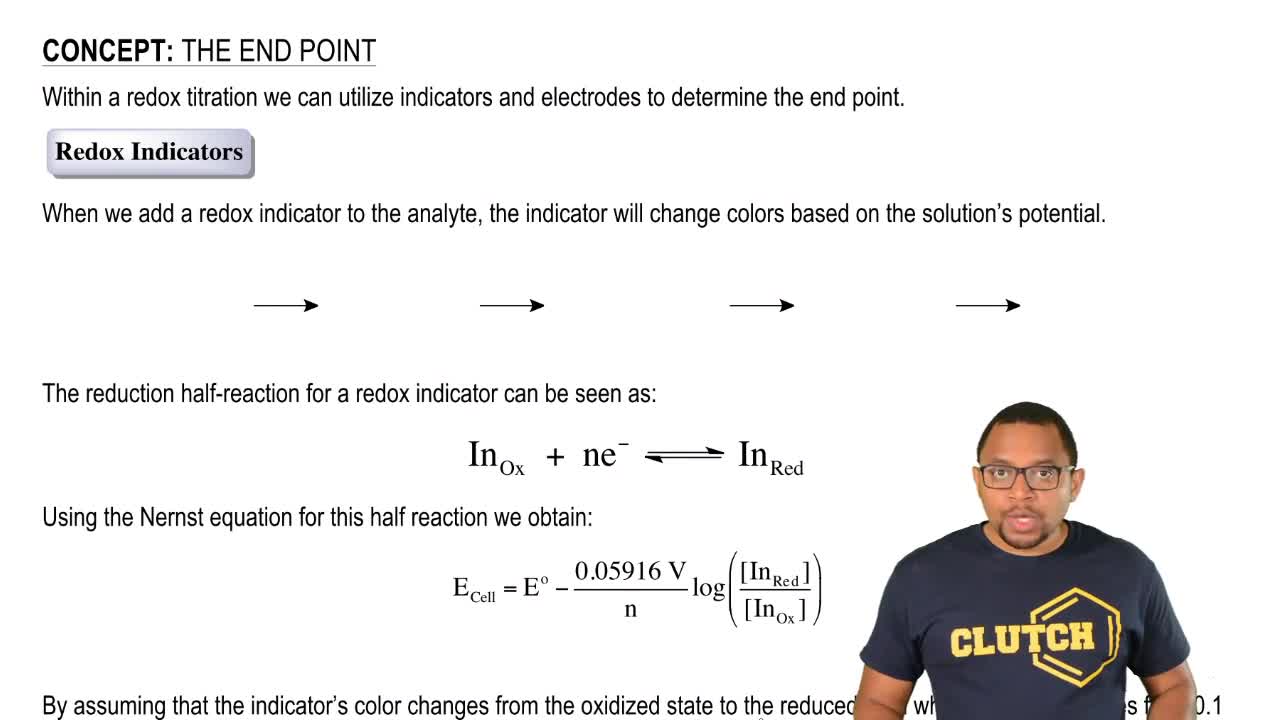
 07:27
07:27