 Back
BackChromosome Mapping and Linkage in Eukaryotes
Study Guide - Smart Notes
 Tailored notes based on your materials, expanded with key definitions, examples, and context.
Chromosome Mapping and Linkage in Eukaryotes
Mendel’s Laws and Linkage
Mendel’s laws of inheritance—specifically the law of segregation and the law of independent assortment—describe how alleles are transmitted from parents to offspring. However, the discovery of gene linkage revealed that not all genes assort independently, especially when they are located close together on the same chromosome.
Law of Segregation: Each diploid organism carries two alleles for each gene, which segregate during gamete formation so that each gamete receives only one allele.
Law of Independent Assortment: The segregation of alleles for one gene occurs independently of alleles for another gene, unless the genes are linked.
Linked Genes: Genes located on the same chromosome tend to be inherited together and do not assort independently.
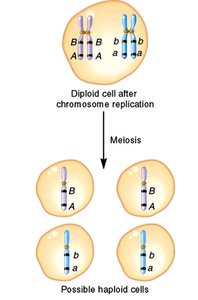
Illustration: Without crossing over, linked alleles segregate together during meiosis, producing only parental combinations in the gametes.
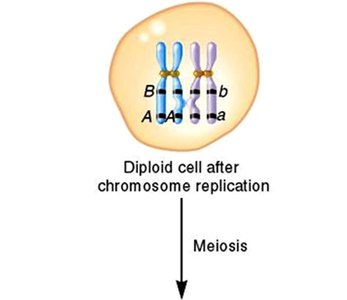
Illustration: Crossing over during meiosis can reassort linked alleles, resulting in recombinant gametes.
Genetic Recombination and Chiasma Formation
Genetic recombination occurs when homologous chromosomes exchange segments during meiosis, producing new combinations of alleles. The physical site of crossover is called the chiasma.
Parental (Non-recombinant) Gametes: Gametes that retain the original combination of alleles present in the parent.
Recombinant Gametes: Gametes with new combinations of alleles due to crossing over.
Chiasma Frequency: The frequency of chiasma formation is used to estimate the frequency of recombination between two loci.
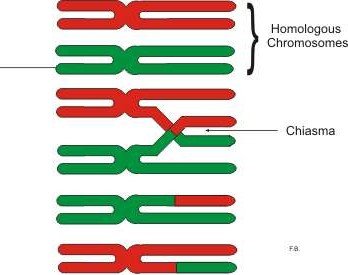
Illustration: Chiasma formation between homologous chromosomes leads to genetic recombination.
Historical Discoveries in Linkage and Mapping
The concept of gene linkage and chromosome mapping was established through the work of several geneticists:
William Bateson and Reginald Punnett: Discovered gene linkage in sweet pea plants (1906).
Thomas Hunt Morgan: Coined the term "linkage" and provided evidence for the chromosome theory of inheritance using Drosophila melanogaster.
Alfred Sturtevant: Created the first genetic linkage map (1913) by analyzing recombination frequencies.
Genetic Mapping: Principles and Applications
Genetic maps, or linkage maps, show the relative positions of genes on a chromosome based on recombination frequencies. These maps are essential for understanding genetic organization, evolutionary relationships, and for applications in medicine and agriculture.
Map Unit (mu) or CentiMorgan (cM): One map unit corresponds to a 1% recombination frequency between two loci.
Testcross: A cross between a heterozygote for two or more genes and a homozygous recessive individual to determine linkage and map distances.
Linkage Analysis in Drosophila melanogaster
Thomas Hunt Morgan’s experiments with fruit flies provided direct evidence for linkage and allowed for the construction of genetic maps. He analyzed X-linked traits such as body color, eye color, and wing length.
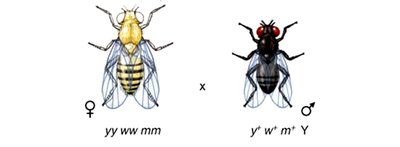
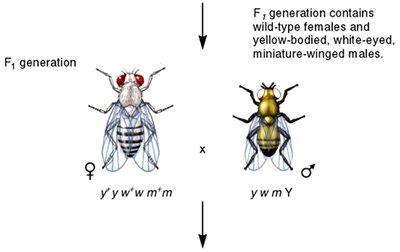
Illustration: Parental and F1 generations in Morgan's linkage experiments with Drosophila.
Chi Square Analysis for Linkage
Chi square analysis is used to test whether observed offspring ratios deviate significantly from expected ratios under independent assortment. A significant deviation suggests linkage between genes.
Formula:
Degrees of Freedom (df): Number of phenotypic categories minus one.
Interpretation: A large chi square value (with a low probability) leads to rejection of the independent assortment hypothesis, supporting linkage.
Calculating Map Distances
The frequency of recombinant offspring is used to estimate the distance between genes on a chromosome.
Map Distance Formula:
Interpretation: Higher recombination frequencies indicate greater distances between genes.
Sturtevant’s Genetic Mapping in Drosophila
Sturtevant used recombination data from dihybrid and trihybrid crosses to construct genetic maps. He found that the accuracy of map distances decreases as the distance between genes increases due to the likelihood of multiple crossovers.

Illustration: Genetic map showing the relative positions and distances between several X-linked genes in Drosophila.
Trihybrid Crosses and Gene Order
Trihybrid crosses (involving three genes) provide information about both gene order and map distances. The most frequent offspring are parental types, while the least frequent are double crossovers.
Example Genes: b (body color), pr (eye color), vg (wing shape)
Map Distance Calculation: For each gene pair, sum the number of recombinant offspring and divide by the total number of progeny, then multiply by 100.
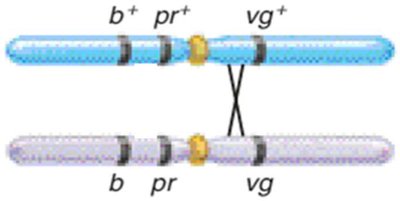
Illustration: Map distances between body color (b), eye color (pr), and wing shape (vg) genes in Drosophila.
Interference and the Coefficient of Coincidence
Interference describes the phenomenon where one crossover event reduces the probability of another crossover occurring nearby. The coefficient of coincidence (C) and interference (i) are calculated as follows:
Coefficient of Coincidence (C):
Interference (i):
Interpretation: Positive interference (i > 0) means fewer double crossovers than expected; negative interference (rare) means more double crossovers than expected.
Summary Table: Key Terms and Concepts in Chromosome Mapping
Term | Definition | Example/Application |
|---|---|---|
Linkage | Genes located on the same chromosome that tend to be inherited together | Body color and eye color genes in Drosophila |
Recombination | Exchange of genetic material between homologous chromosomes | Crossing over during meiosis |
Map Unit (cM) | Unit of genetic distance; 1% recombination frequency | 6.1 cM between b and pr genes |
Testcross | Cross between a heterozygote and a homozygous recessive | Used to determine linkage and map distances |
Interference | Reduction in the probability of a second crossover near a first crossover | i = 0.6 (60% interference) |
Major Aspects of Genetic Mapping
Determination of the linear order of genes on a chromosome
Estimation of distances between genes using recombination frequencies
Application in understanding genetic diseases, evolutionary biology, and selective breeding
Example Calculation:
If the map distance between loci B and C is 12 map units, then 12% of the gametes should be recombinant types (6% Bc and 6% bC).
If the genotypes Ab/aB produce 8% each of the recombinant gametes AB and ab, the distance between A and B is 16 mu.
