 Back
BackEukaryotic Gene Mapping: Classical and Deletion Mapping Approaches
Study Guide - Smart Notes
 Tailored notes based on your materials, expanded with key definitions, examples, and context.
Eukaryotic Gene Mapping
Introduction to Gene Mapping in Eukaryotes
Gene mapping is a fundamental technique in genetics used to determine the relative positions of genes on chromosomes. Classical mapping methods, such as testcrosses, and modern approaches, like deletion mapping, provide insights into gene order, distance, and chromosomal location. These methods are essential for understanding inheritance patterns and for identifying genes responsible for specific traits.
Classical Mapping Methods
Dihybrid and Trihybrid Testcrosses
Dihybrid and trihybrid testcrosses are classical genetic tools used to map genes based on recombination frequencies. These crosses help determine whether genes are located on the same chromosome (linked) or on different chromosomes (unlinked), their order, and the distances between them.
Dihybrid Testcross: Involves two genes and reveals whether they assort independently (unlinked, 1:1:1:1 ratio) or are linked (deviation from 1:1:1:1 ratio). It also allows calculation of the distance between two genes based on recombinant offspring frequencies.
Trihybrid Testcross: Involves three genes and provides information about the order of genes and the distances between all three. It is particularly useful for constructing more detailed genetic maps.
Key Concepts: Identification of recombinant gametes, drawing chromosomal arrangements, and predicting expected offspring ratios are essential skills for interpreting mapping crosses.
Example: If two genes in squash (vine height and fruit color) are tested in a dihybrid cross and the recombinant frequency is 10.8%, the genes are 10.8 centimorgans (cM) apart.
Chromosome Alterations and Their Role in Mapping
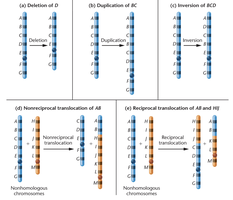
Types of Chromosome Alterations
Chromosome structure can be altered in several ways, each with implications for gene mapping and genetic analysis.
Deletion: Loss of a chromosome segment, which can unmask recessive alleles (pseudodominance).
Duplication: Repetition of a chromosome segment, leading to gene dosage effects.
Inversion: A chromosome segment is reversed end to end, potentially disrupting gene function.
Nonreciprocal Translocation: A segment from one chromosome is transferred to a nonhomologous chromosome without reciprocal exchange.
Reciprocal Translocation: Exchange of segments between two nonhomologous chromosomes.
Deletion Mapping
Principle of Deletion Mapping
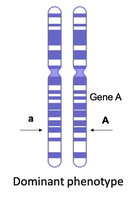
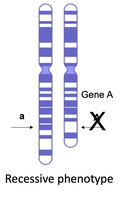
Deletion mapping is a technique that uses known chromosomal deletions to localize genes. When a deletion removes the dominant allele, the recessive allele on the homologous chromosome is expressed, a phenomenon known as pseudodominance.
Pseudodominance: The expression of a recessive phenotype due to the deletion of the dominant allele. This allows researchers to map the location of genes by observing which deletions uncover the recessive phenotype.
Deficiency Lines: In model organisms like Drosophila, lines with specific chromosomal deletions (deficiencies) are bred to facilitate mapping experiments.
Deletion Mapping Example: The Drosophila White Gene
In Drosophila, the white gene (w) controls eye color. Deletion mapping can pinpoint the location of this gene by crossing flies with known deletions to those carrying the mutant allele and observing the resulting phenotypes.
w+ (W): Dominant wild-type allele, red eyes
w: Recessive mutant allele, white eyes
When a deletion uncovers the w allele, the fly exhibits white eyes, indicating the deletion spans the white gene's location.
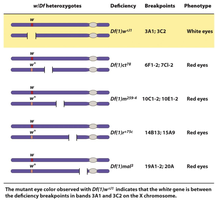
Interpreting Deletion Mapping Data
To locate a gene, researchers cross an organism with a recessive mutant phenotype to several deficiency lines. The offspring's phenotypes are scored as wild type (+) or mutant (m). The gene's location is inferred from which deletions result in the mutant phenotype.
If all deletions overlapping a specific region result in the mutant phenotype, the gene is likely located within that region.
Deletions not overlapping the gene will not reveal the mutant phenotype.
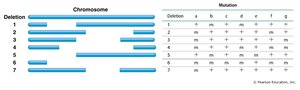
Example Table: Deletion Mapping Results
Deficiency Line | W | P | Rs | Y | Xf | Qs | Lk |
|---|---|---|---|---|---|---|---|
1 | m | + | + | + | + | + | + |
2 | m | m | + | + | + | + | + |
3 | + | m | m | m | + | + | + |
4 | + | + | m | m | m | + | + |
5 | + | + | + | m | m | m | + |
6 | + | + | + | + | m | m | m |
7 | + | + | + | + | + | m | m |
Additional info: The table above is a logical reconstruction based on the description of deficiency mapping experiments. The 'm' indicates mutant phenotype, '+' indicates wild type.
Comparison: Single-Gene vs. Multi-Gene Trait Mapping
Limitations of Classical Mapping
Classical mapping techniques, such as testcrosses and deletion mapping, are most effective for traits controlled by a single gene, where each gene produces a clear, discrete phenotype. These methods are less effective for complex traits influenced by multiple genes (quantitative traits).
Single-Gene Traits: Produce distinct phenotypes that can be easily scored and mapped.
Multi-Gene Traits: Require advanced methods such as Quantitative Trait Loci (QTL) mapping or Genome-Wide Association Studies (GWAS) to identify contributing genes.
Example: Eye color in Drosophila is a single-gene trait, while human height is a quantitative trait influenced by many genes.
Summary Table: Classical vs. Modern Mapping Methods
Method | Best For | Key Feature |
|---|---|---|
Testcross (Dihybrid/Trihybrid) | Single-gene traits | Determines gene order and distance |
Deletion Mapping | Single-gene traits | Locates gene on chromosome using deficiencies |
QTL Mapping | Quantitative traits | Associates DNA markers with phenotypes |
GWAS | Complex traits (e.g., diseases) | Associates genetic variants with traits in populations |
