 Back
BackGene Interaction and Allelic Relationships: Structured Study Notes for Genetics Students
Study Guide - Smart Notes
 Tailored notes based on your materials, expanded with key definitions, examples, and context.
Gene Interaction and Allelic Relationships
Types of Gene Interactions
Gene interaction refers to the phenomenon where two or more genes influence a single trait, and the expression of a trait may depend on the interaction of genes with each other or with environmental factors. Understanding these interactions is fundamental to interpreting complex inheritance patterns.
Multiple alleles: More than two alleles may exist for a gene within a population.
Dominance relationships: Dominance may be complete, incomplete, or codominant.
Gene-gene interaction: Two or more genes may affect a single trait.
Gene-environment interaction: Expression of a trait may depend on both genetic and nongenetic factors.
Dominance Relationships Between Alleles
Dominance is a phenotypic concept, determined by the protein product of an allele. The phenotype is the result of the activities of the protein products of the alleles present.
Complete dominance: One allele masks the effect of another in heterozygotes.
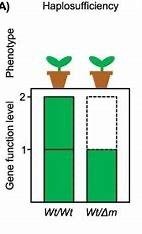
Haplosufficiency: One copy of a dominant allele is sufficient for normal function.
Haploinsufficiency: One copy of a wild-type allele is not enough for normal function.
Example: Mutant Allele Recessive to Wild-Type
Wild-type allele (R+) produces active enzyme (50 units); mutant allele (r) produces little or no enzyme.
40+ units of enzyme activity produce wild-type phenotype: R+R+ (100 units) or R+r (50 units) are wild-type.
rr individuals (0 units) have mutant phenotype; mutant allele is recessive.
Wild-type allele is haplosufficient.
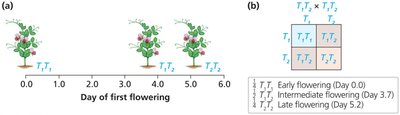
Example: Mutant Allele Dominant to Wild-Type
Allele T1 produces 10 units of enzyme; mutant allele T2 produces 5 units.
18+ units required for wild-type phenotype: only T1T1 (20 units) is wild-type.
T1T2 (15 units) and T2T2 (10 units) are mutant; mutant allele is dominant.
Wild-type allele is haploinsufficient.
Functional Effects of Mutation
Mutant alleles can be classified based on their effect on gene function:
Loss-of-function: Significant decrease or complete loss of gene product.
Gain-of-function: Gene product acquires new function or increased activity.
Loss-of-Function Mutations
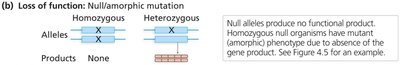
Null (amorphic) mutations: No functional gene product; often lethal when homozygous.
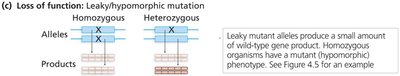
Leaky (hypomorphic) mutations: Partial loss of function; severity depends on activity level.
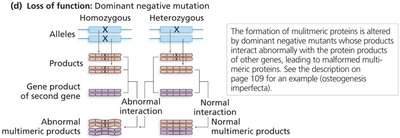
Dominant negative mutations: Multimeric proteins are disrupted by mutant polypeptides, leading to loss of function.
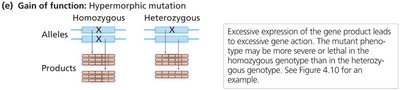
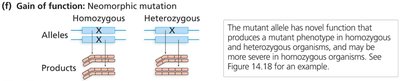
Gain-of-Function Mutations
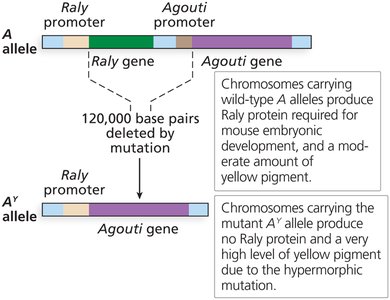
Hypermorphic: Increased gene activity.
Neomorphic: Novel gene activity not found in wild type.
Usually dominant.
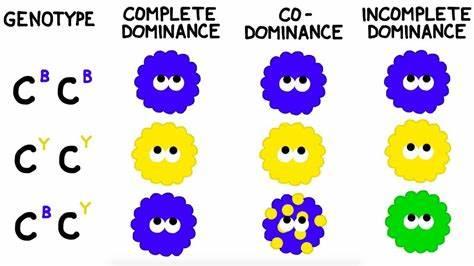
Incomplete Dominance and Codominance
Dominance is not always complete. In incomplete dominance, heterozygotes display intermediate phenotypes. In codominance, both alleles are expressed in heterozygotes.
Incomplete dominance: Heterozygotes show intermediate phenotype.
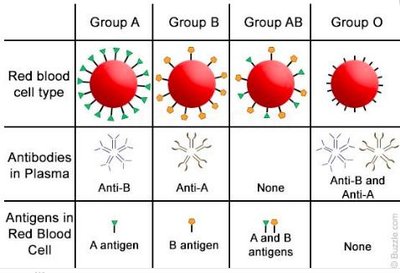
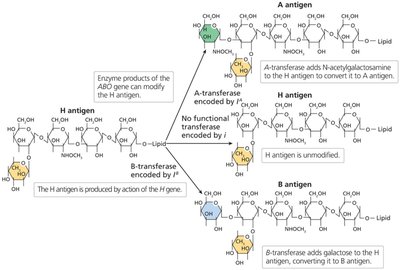
Codominance: Both alleles are fully expressed; e.g., ABO blood group.
ABO Blood Group System
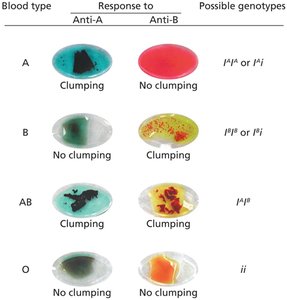
The ABO blood type is determined by three alleles (IA, IB, i). IA and IB are codominant to each other and dominant over i.
Blood type A: IAIA or IAi
Blood type B: IBIB or IBi
Blood type AB: IAIB
Blood type O: ii

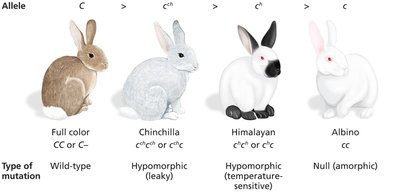
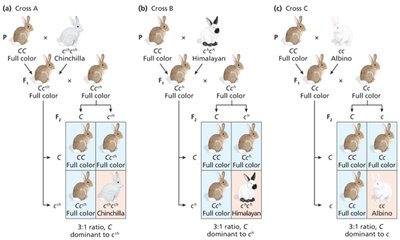
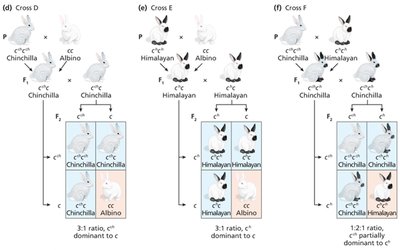
Allelic Series and Coat Color in Mammals
Some genes have multiple alleles forming an allelic series, with a hierarchy of dominance. The C gene in mammals controls coat color via tyrosinase enzyme activity.
C: Full color (wild-type)
cch: Chinchilla (dilute)
ch: Himalayan (temperature-sensitive)
c: Albino (null)
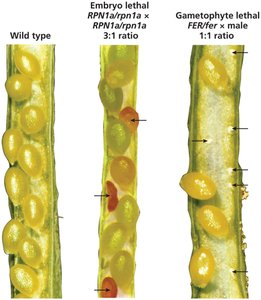
Lethal Alleles
Lethal alleles cause death when present in certain genotypes. Recessive lethal alleles are only lethal in homozygotes and can be detected by distorted segregation ratios.
Embryonic lethals: Fail to produce homozygous lethal progeny.
Gametophytic lethals: Fail to generate lethal allele-carrying gametes.
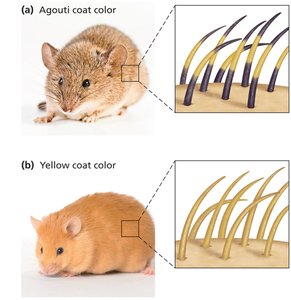
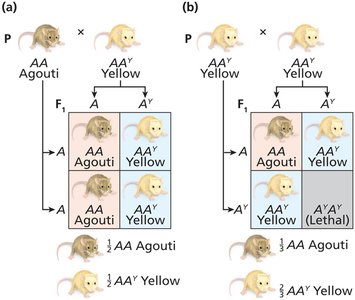
Lethal Alleles in Animals
Agouti coat color in mice: AY allele is dominant for yellow pigment but recessive lethal.
All yellow mice are heterozygous (AAY); homozygotes die.
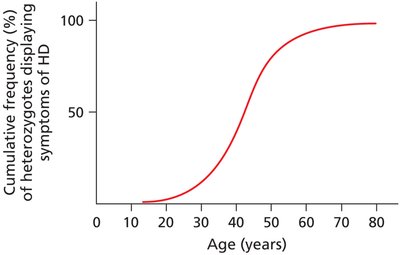
Delayed Age of Onset
Dominant lethal alleles may persist if symptoms appear after reproductive age.
Example: Huntington disease (HD), symptoms appear in late thirties or forties.
Variable Phenotypes and Penetrance
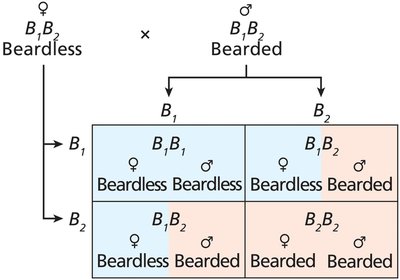
Sex-Limited and Sex-Influenced Traits
Some traits are influenced by the sex of the organism due to hormonal differences.
Sex-limited traits: Genes are present in both sexes but expressed in only one.
Sex-influenced traits: Phenotype differs depending on sex for the same genotype.
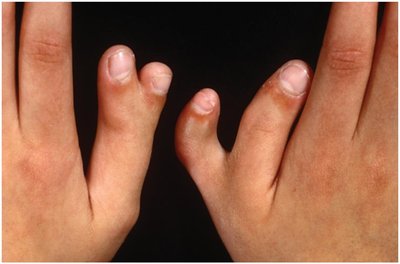
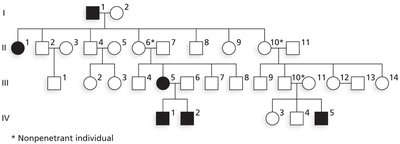
Incomplete Penetrance
Penetrance refers to the proportion of individuals with a genotype that express the expected phenotype. Incomplete penetrance occurs when not all individuals with the genotype show the phenotype.
Example: Polydactyly (extra fingers/toes) is autosomal dominant but nonpenetrant in 25–30% of carriers.
Variable Expressivity
Variable expressivity occurs when individuals with the same genotype show a range of phenotypes in severity or form.
Example: Waardenburg syndrome, same genotype but different symptoms in family members.
Gene–Environment Interactions
Gene–Environment Interaction
Environmental factors can influence gene expression and phenotype. This interaction is important in understanding hereditary diseases and their prevention.
Example: Phenylketonuria (PKU) can be managed by dietary restriction of phenylalanine.
Pleiotropy
Pleiotropic Genes
Pleiotropy occurs when a single gene affects multiple distinct traits. Mutations in pleiotropic genes can have widespread effects.
Example: Sickle cell disease, caused by mutation in β-globin gene, affects multiple physiological traits.
Gene Interaction Modifies Mendelian Ratios
Gene Interaction in Pathways
Genes often work together in biochemical pathways, affecting the production of complex traits. The one gene–one enzyme hypothesis was foundational in understanding these pathways.
Anabolic pathways: Biosynthesis of complex compounds.
Catabolic pathways: Degradation of complex compounds.
Signal transduction and developmental pathways: Multiple genes interact.
Epistasis
Epistasis is gene interaction that alters phenotypic ratios from Mendelian expectations. It is detected in dihybrid crosses.
No interaction: 9:3:3:1 ratio (e.g., feather color in budgerigar parakeets).
Complementary gene interaction: 9:7 ratio (e.g., flower color in sweet peas).
Duplicate gene action: 15:1 ratio (redundant system).
Dominant gene interaction: 9:6:1 ratio (e.g., fruit shape in summer squash).
Recessive epistasis: 9:3:4 ratio (e.g., coat color in Labrador retrievers).
Dominant epistasis: 12:3:1 ratio (e.g., color in summer squash).
Dominant suppression: 13:3 ratio (e.g., flower color in blue pimpernel).
Complementation Analysis
Genetic Complementation
Complementation analysis distinguishes mutations in the same gene from those in different genes. It is performed by mating pure-breeding mutants and observing F1 phenotypes.
Complementation: Wild-type offspring indicate mutations in different genes.
No complementation: Mutant offspring indicate mutations in the same gene.
Complementation group: Refers to a gene; mutations that fail to complement are in the same group.
Summary Table: Types of Gene Interaction and Their Effects
Type of Interaction | Phenotypic Ratio | Example |
|---|---|---|
No interaction | 9:3:3:1 | Feather color in budgerigar parakeets |
Complementary gene interaction | 9:7 | Flower color in sweet peas |
Duplicate gene action | 15:1 | Redundant gene systems |
Dominant gene interaction | 9:6:1 | Fruit shape in summer squash |
Recessive epistasis | 9:3:4 | Coat color in Labrador retrievers |
Dominant epistasis | 12:3:1 | Color in summer squash |
Dominant suppression | 13:3 | Flower color in blue pimpernel |
Additional info: These notes expand on the original slides and textbook excerpts, providing definitions, examples, and context for each concept. All included images are directly relevant to the adjacent explanations and reinforce key genetic principles.
