 Back
BackLecture 5
Study Guide - Smart Notes
 Tailored notes based on your materials, expanded with key definitions, examples, and context.
Modifications to Mendelian Genetics
Introduction to Mendelian Genetics and Its Limitations
Mendelian genetics describes inheritance patterns based on single-gene traits with clear dominant and recessive alleles. However, most traits in nature do not follow these simple rules. Instead, they are influenced by multiple genes and complex interactions, leading to a variety of inheritance patterns.
Monogenic traits: Traits controlled by a single gene, as studied by Mendel in pea plants.
Polygenic (multigenic) traits: Traits controlled by two or more genes, often resulting in more complex phenotypic ratios.
Complete dominance: One allele completely masks the effect of another.
Penetrance: The proportion of individuals with a particular genotype that actually displays the associated phenotype.
Modifications to Simple Mendelian Rules
Many traits deviate from Mendel's observations due to:
Sex linkage
Incomplete dominance
Codominance
Multiple alleles
Lethal alleles
Conditional alleles
Variable penetrance and expressivity
Gene interactions (epistasis)
Genetic linkage
Multigenic Traits and Gene Interactions
Polygenic Inheritance
Most phenotypes are controlled by more than one gene. These multigenic or polygenic traits often show a range of phenotypes and do not follow the simple Mendelian ratios.
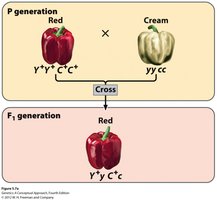
Example: Fruit color in pepper plants is controlled by two genes, Y and C, which encode enzymes for red and yellow carotenoid pigments. Wild-type peppers are red, while double homozygous recessive mutants (yy cc) are cream colored.
Dihybrid Crosses: Two Genes, Same Trait
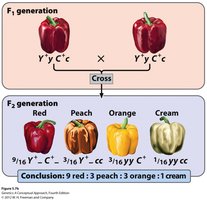
When two genes control the same trait, the classic 9:3:3:1 Mendelian ratio can yield more than two phenotypes. For example, in peppers:
9/16 Y- C-: Red
3/16 Y- cc: Peach
3/16 yy C-: Orange
1/16 yy cc: Cream
Molecular explanation: Both genes are required for the full red color; mutations in either gene reduce pigment production, resulting in different colors.
Gene Interaction: Epistasis
Epistasis occurs when the genotype at one gene masks or alters the phenotype produced by another gene. This interaction modifies the expected Mendelian ratios in dihybrid crosses.
Epistasis: A genetic interaction where one gene masks or modifies the effect of another gene.
Modified ratios: The classic 9:3:3:1 ratio can be altered to 9:3:4, 9:7, 15:1, etc., depending on the type of interaction.
Types of Epistasis and Modified Ratios
Recessive Epistasis (9:3:4 Ratio)
In recessive epistasis, the homozygous recessive genotype at one locus masks the expression of alleles at another locus. A classic example is coat color in Labrador retrievers:
B gene: Black pigment (B-) or brown (bb)
E gene: Allows pigment deposition (E-) or prevents it (ee, resulting in yellow)
Genotypes and phenotypes:
B- E-: Black
bb E-: Brown
B- ee or bb ee: Yellow (regardless of B locus)
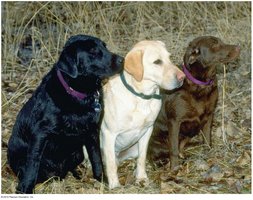
The F2 ratio is 9 black : 3 brown : 4 yellow, demonstrating recessive epistasis.
Duplicate Recessive Epistasis (9:7 Ratio)
In duplicate recessive epistasis, recessive alleles at either of two loci produce the same phenotype. Both genes are required for the wild-type phenotype. An example is flower color in peas:
Both C and P genes are needed for purple pigment production.
Genotypes and phenotypes:
C- P-: Purple
C- pp, cc P-, cc pp: White
The F2 ratio is 9 purple : 7 white.
Duplicate Dominant Epistasis (15:1 Ratio)
In duplicate dominant epistasis, a dominant allele at either of two loci produces the same phenotype. Only the double recessive homozygote shows the mutant phenotype. An example is kernel color in wheat:
Genotypes and phenotypes:
A- B-, aa B-, A- bb: Pigmented
aa bb: No pigment
The F2 ratio is 15 pigmented : 1 unpigmented.
Summary Table: Modified Dihybrid Ratios Due to Gene Interaction
Ratio | Genotype | Type of Interaction | Example |
|---|---|---|---|
9:3:3:1 | A- B-, A- bb, aa B-, aa bb | None | Seed shape and color in peas |
9:3:4 | A- B-, aa B-, A- bb + aa bb | Recessive epistasis | Coat color in Labrador retrievers |
12:3:1 | A- B- + A- bb, aa B-, aa bb | Dominant epistasis | Color in squash |
9:7 | A- B-, aa B- + A- bb + aa bb | Duplicate recessive epistasis | Albinism in snails |
15:1 | A- B- + aa B- + A- bb, aa bb | Duplicate dominant epistasis | Kernel color in wheat |
The Complementation Test
Purpose and Principle
The complementation test is a genetic technique used to determine whether two mutants with the same phenotype have mutations in the same gene or in different genes affecting the same process.
Complementation: If crossing two mutants yields wild-type offspring, the mutations are in different genes (they complement each other).
Non-complementation: If the offspring are mutant, the mutations are in the same gene.
Application Example
Suppose you have six different white-flowered pea mutants. By crossing all possible pairs and observing the F1 phenotypes, you can determine how many genes are involved:
If F1 are wild-type (purple), the mutations are in different genes.
If F1 are mutant (white), the mutations are in the same gene.
This approach allows geneticists to map the number of genes involved in a biological process.
Conclusion
Understanding gene interactions and modifications to Mendelian inheritance is essential for predicting phenotypes in genetic crosses. By recognizing the types of epistasis and using tools like the complementation test, geneticists can dissect complex traits and the underlying genetic architecture.
