 Back
BackGene Interactions and Modifications to Mendelian Genetics
Study Guide - Smart Notes
 Tailored notes based on your materials, expanded with key definitions, examples, and context.
Modifications to Mendelian Genetics
Introduction to Mendelian Genetics and Its Limitations
Mendelian genetics describes inheritance patterns based on single-gene traits with clear dominant and recessive alleles. However, most traits in nature do not follow these simple rules. Instead, they are influenced by multiple genes and complex interactions, leading to a variety of phenotypic ratios and outcomes.
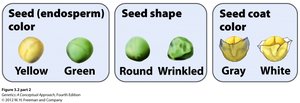
Monogenic traits: Traits controlled by a single gene, as studied by Mendel in pea plants.
Polygenic (multigenic) traits: Traits controlled by two or more genes, often resulting in more complex inheritance patterns.
Complete dominance: One allele completely masks the effect of another.
Penetrance: The proportion of individuals with a particular genotype that actually displays the associated phenotype.
Multigenic Traits and Gene Interactions
Polygenic Inheritance
Most phenotypes are determined by the interaction of multiple genes. These interactions can produce new phenotypic ratios and complicate genetic analysis.
Multigenic traits: Traits influenced by two or more genes, such as fruit color in peppers or coat color in animals.
When two genes control the same trait, the classic Mendelian 9:3:3:1 ratio can yield more than two phenotypes.
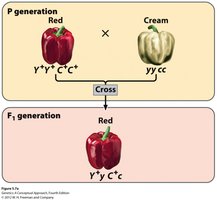
Example: Fruit Color in Pepper Plants
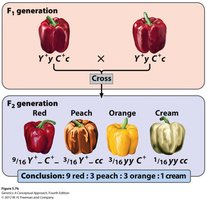
Fruit color in peppers is controlled by two genes, Y and C, which encode enzymes for red and yellow carotenoid pigments. The interaction of these genes produces four phenotypes in the F2 generation:
9/16 Y- C- : Red
3/16 Y- cc : Peach
3/16 yy C- : Orange
1/16 yy cc : Cream
Comparison: Mendelian vs. Multigenic Crosses
In Mendelian dihybrid crosses (two genes, two traits), each gene affects a separate trait, resulting in combinations like yellow round or green wrinkled peas. In multigenic crosses (two genes, one trait), the interaction produces multiple phenotypes for a single trait.
Gene Interaction: Epistasis
Definition and Types of Epistasis
Epistasis occurs when the genotype at one gene locus masks or modifies the effect of a genotype at another locus. This interaction alters the expected Mendelian ratios in the F2 generation.
Recessive epistasis: The recessive genotype at one locus masks the phenotype at another locus (e.g., 9:3:4 ratio).
Duplicate recessive epistasis: Recessive alleles at either of two loci produce the same phenotype (9:7 ratio).
Duplicate dominant epistasis: A dominant allele at either locus produces the same phenotype (15:1 ratio).
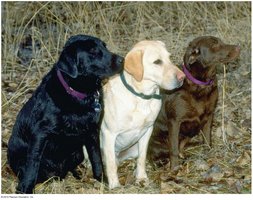
Recessive Epistasis: Labrador Retriever Coat Color
In Labrador retrievers, two genes determine coat color: B (black/brown pigment) and E (expression of pigment). The ee genotype masks the effect of the B gene, resulting in yellow coats regardless of the B genotype. The F2 ratio is 9 black : 3 brown : 4 yellow.
B- E- : Black
bb E- : Brown
B- ee or bb ee : Yellow
Duplicate Recessive Epistasis: Flower Color in Peas
Two genes, C and P, are both required for purple flower color in peas. Homozygosity for the recessive allele at either locus results in white flowers. The F2 ratio is 9 purple : 7 white.
C- P- : Purple
C- pp, cc P-, cc pp : White
Duplicate Dominant Epistasis: Wheat Kernel Color
In wheat, either of two dominant alleles is sufficient to produce pigmented kernels. Only the double recessive genotype (aabb) results in unpigmented kernels. The F2 ratio is 15 pigmented : 1 unpigmented.
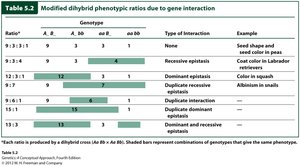
Summary Table: Modified Dihybrid Ratios
Ratio | Genotype | Type of Interaction | Example |
|---|---|---|---|
9:3:3:1 | A- B-, A- bb, aa B-, aa bb | None | Seed shape and color in peas |
9:3:4 | A- B-, aa B-, A- bb + aa bb | Recessive epistasis | Coat color in Labrador retrievers |
12:3:1 | A- B- + A- bb, aa B-, aa bb | Dominant epistasis | Color in squash |
9:7 | A- B-, aa B- + A- bb + aa bb | Duplicate recessive epistasis | Albinism in snails |
15:1 | A- B- + aa B- + A- bb, aa bb | Duplicate dominant epistasis | Wheat kernel color |

The Complementation Test
Purpose and Method
The complementation test is used to determine whether two mutants with the same phenotype have mutations in the same gene or in different genes. This is done by crossing the two mutants and observing the phenotype of the F1 offspring.
If the F1 shows the wild-type phenotype, the mutations are in different genes (they complement each other).
If the F1 shows the mutant phenotype, the mutations are in the same gene (they fail to complement).
This test is essential for genetic analysis, especially when multiple mutants with similar phenotypes are isolated.
Conclusion
Understanding gene interactions and modifications to Mendelian genetics is crucial for predicting phenotypes in genetic crosses. By recognizing the types of gene interactions and using tools like the complementation test, geneticists can dissect the genetic basis of complex traits.
