 Back
BackGene Interactions and Their Effects on Phenotype
Study Guide - Smart Notes
 Tailored notes based on your materials, expanded with key definitions, examples, and context.
Gene Interactions
Overview of Gene Interactions
Gene interactions describe the ways in which multiple genes collaborate or interact to influence a phenotype. While Mendel studied traits controlled by two alleles, most traits in nature are influenced by more complex interactions involving multiple alleles and genes. Understanding these interactions is essential for interpreting phenotypic variation and inheritance patterns.
Gene interaction: The influence of two or more genes on a single trait.
Allelic interaction: Dominance relationships between alleles at a single locus.
Phenotypes often result from the combined activities of protein products encoded by different alleles.
The Molecular Basis of Dominance
Dominance and Recessiveness
Dominance is a phenotypic concept, but its molecular basis lies in the protein products of alleles. The dominant allele typically produces a functional protein, while the recessive allele may produce a nonfunctional or less functional protein.
Haplosufficient: One copy of the wild-type allele is sufficient to produce the wild-type phenotype.
Haploinsufficient: One copy of the wild-type allele is not sufficient; two are required for the wild-type phenotype.
Effects of Mutation
Gain-of-function mutation: The gene product acquires a new function or increased activity (often dominant).
Loss-of-function mutation: The gene product has reduced or no activity (often recessive).
Null (amorphic) mutation: Complete loss of function, often lethal when homozygous.
Leaky (hypomorphic) mutation: Partial loss of function; phenotype severity depends on activity level.
Hypermorphic mutation: Increased gene activity, usually dominant.
Neomorphic mutation: Novel gene activity not found in wild type, usually dominant.
Dominance Relationships
Incomplete Dominance
Incomplete dominance occurs when the heterozygote displays a phenotype intermediate between the two homozygotes. The heterozygote is often more similar to one homozygote than the other.
Allele designations: A1, A2, B1, B2
Example: Flower color in snapdragons (red, pink, white)
Co-dominance
Co-dominance results in heterozygotes expressing both alleles distinctly, leading to a phenotype different from either homozygote. Both alleles are detectable in the phenotype.
Example: ABO blood type in humans
Alleles: IA, IB, i
IA and IB are co-dominant; both are dominant over i
Blood Type | Genotype |
|---|---|
A | IAIA or IAi |
B | IBIB or IBi |
AB | IAIB |
O | ii |
Multiple Alleles and Allelic Series
Allelic Series
Some genes have more than two alleles, forming an allelic series with a defined order of dominance. This is common in traits like coat color in mammals.
Multiple alleles: More than two alleles exist for a locus in a population.
Allelic series: Sequential dominance relationships among alleles.
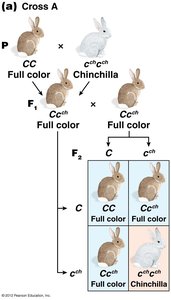
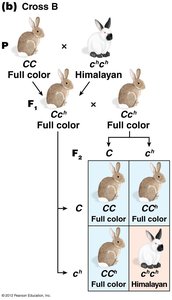
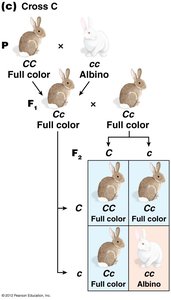
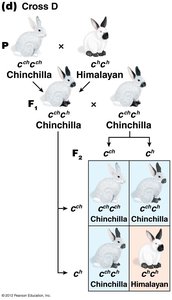
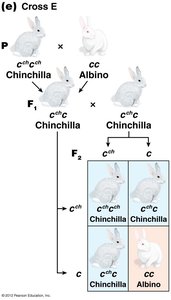
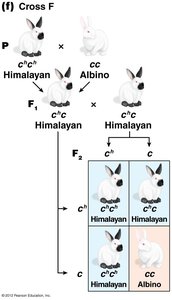
The C-Gene System for Mammalian Coat Color
The C gene controls coat color in mammals by producing an enzyme for melanin synthesis. Four main alleles form an allelic series:
C: Full color (wild type)
cch: Chinchilla (dilute color)
ch: Himalayan (color on extremities)
c: Albino (null allele, no pigment)
Dominance relationships: C > cch > ch > c
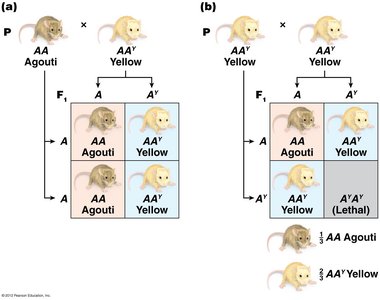
Lethal Alleles
Lethal Mutations
Lethal alleles cause death when present in certain genotypes, often as recessive alleles. They can distort expected Mendelian ratios due to missing progeny classes.
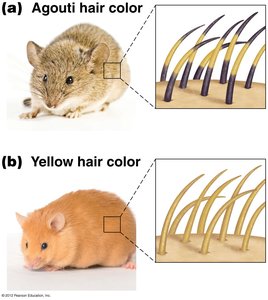
Recessive lethal: Homozygotes die (e.g., AY allele in mice).
Dominant lethal: Death occurs even in heterozygotes (e.g., Huntington's disease).
Epistasis
Epistatic Interactions
Epistasis occurs when alleles of one gene modify or prevent the expression of alleles of another gene. It is commonly observed in multistep biochemical pathways and can alter expected phenotypic ratios in dihybrid crosses.
Minimum of two genes required for epistasis.
Six main types of epistatic interactions, each modifying the 9:3:3:1 dihybrid ratio.
No Interaction (9:3:3:1 Ratio)
When genes do not interact, the classic Mendelian ratio is observed. Example: Eye color genes in Drosophila.
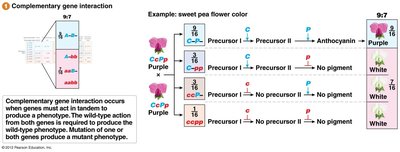
Complementary Gene Interaction (9:7 Ratio)
Complementary gene interaction occurs when two genes must act together to produce a phenotype. Mutation in either gene results in a mutant phenotype.
Example: Anthocyanin pigment synthesis in sweet peas.
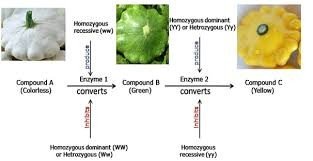
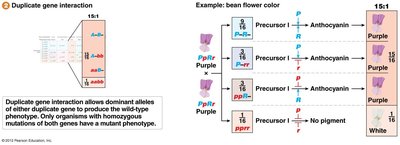
Duplicate Gene Interaction (15:1 Ratio)
Duplicate gene interaction allows dominant alleles of either gene to produce the wild-type phenotype. Only double homozygous mutants show the mutant phenotype.
Example: Bean flower color.
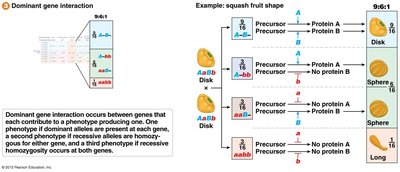
Dominant Gene Interaction (9:6:1 Ratio)
Dominant gene interaction occurs when each gene contributes to a phenotype. Presence of dominant alleles at both genes produces one phenotype, at one gene produces a second, and at neither produces a third.
Example: Squash fruit shape.
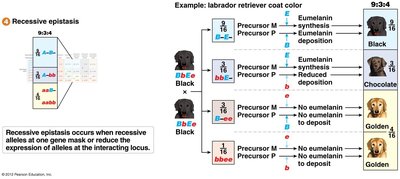
Recessive Epistasis (9:3:4 Ratio)
Recessive epistasis occurs when recessive alleles at one gene mask the expression of alleles at another locus.
Example: Labrador retriever coat color.
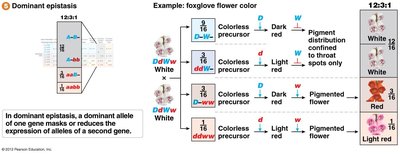
Dominant Epistasis (12:3:1 Ratio)
Dominant epistasis occurs when a dominant allele at one gene masks or reduces the expression of alleles at a second gene.
Example: Foxglove flower color.
Summary Table: Gene Interaction Types and Ratios
Gene Interaction | Phenotype Ratio | Example |
|---|---|---|
None | 9:3:3:1 | Drosophila eye color |
Complementary | 9:7 | Sweet pea flower color |
Duplicate | 15:1 | Bean flower color |
Dominant | 9:6:1 | Squash fruit shape |
Recessive epistasis | 9:3:4 | Labrador coat color |
Dominant epistasis | 12:3:1 | Foxglove flower color |
Practice Problems
Sweet Pea Anthocyanin Synthesis
a) Pure-breeding plant unable to catalyze the first reaction: White petals
b) Pure-breeding plant unable to catalyze the second reaction: White petals
c) Cross between plants in a and b: F1 plants have purple petals (complementation)
d) F1 crossed: F2 phenotypic ratio is 9:7 (purple:white)
Zucchini Fruit Color
F1 plants all green; F2 ratio: 180 green, 140 yellow (approx. 9:7 ratio)
Genotypes: Green parent (dominant alleles at both loci), yellow parent (homozygous recessive at one or both loci)
Key Equations
