 Back
BackGene Interactions: Patterns, Mechanisms, and Genetic Analysis
Study Guide - Smart Notes
 Tailored notes based on your materials, expanded with key definitions, examples, and context.
Gene Interactions
Introduction to Gene Interactions
Gene interactions describe how alleles at a single locus or multiple loci influence phenotypes, often deviating from simple Mendelian inheritance. Understanding these interactions is crucial for interpreting complex traits and genetic pathways.
Single locus interactions: Allele interactions at one gene.
Complex inter-genic interactions: Multiple genes affecting a trait.
Single Locus Interactions
Mutations and Alleles
Mutations create new alleles, which can alter protein function and thus phenotype. These effects are classified as loss-of-function or gain-of-function mutations.
Loss-of-function mutations: Decrease or eliminate gene product activity.
Null mutations: Produce non-functional protein.
Leaky mutations: Retain partial function.
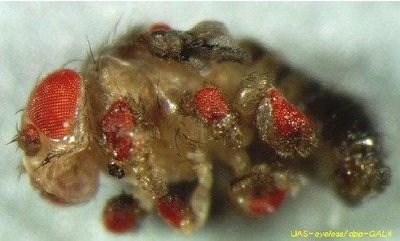
Gain-of-function mutations: Increase activity or confer new function.
Hypermorphic: Higher activity than wild-type.
Neomorphic: New type of activity.
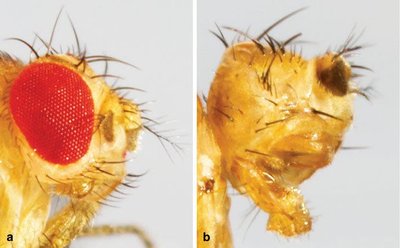
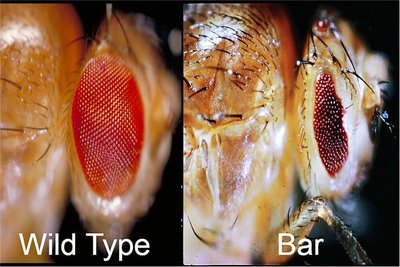
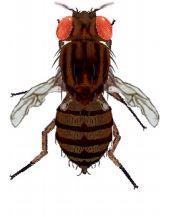
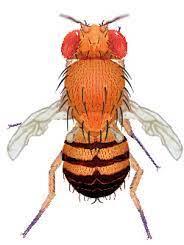
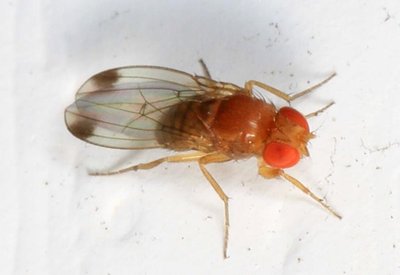
Example: Mutations in a gene controlling Drosophila eye formation can result in various phenotypes, from partial eye development to complete absence.
Dominance Patterns in Mutations
Not all mutations are recessive. Some mutant alleles act as dominant due to mechanisms such as dominant negative effects or haploinsufficiency.
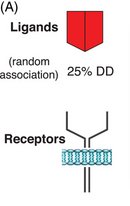
Dominant negative alleles: Mutant protein interferes with wild-type protein function.
Haploinsufficiency: One functional allele is insufficient for normal phenotype.
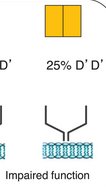
Example: Signal transmission requires two components coded by the same gene. Mutant alleles can disrupt this process, leading to dominant phenotypes.
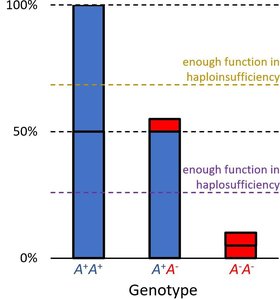
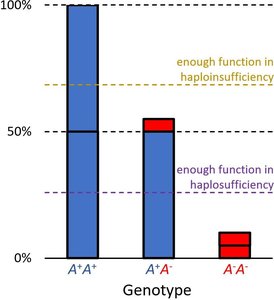
Haplosufficiency vs. Haploinsufficiency
Phenotype depends on whether a single functional allele can meet the threshold for normal activity.
Haplosufficient: One wild-type allele is enough for normal function; wild-type acts as dominant.
Haploinsufficient: One wild-type allele is not enough; mutant acts as dominant.
Example: Enzyme activity levels determine color phenotype. Thresholds for activity distinguish haplosufficient from haploinsufficient systems.


Other Single Gene Patterns
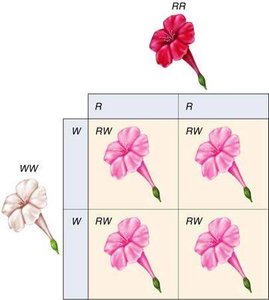
Incomplete Dominance
Heterozygotes display a phenotype intermediate between homozygotes. This is distinct from blending inheritance.
Example: Four-o'clock plant pigment: RR (red), RW (pink), WW (white).
Co-Dominance
Both alleles in a heterozygote are fully expressed in the phenotype.
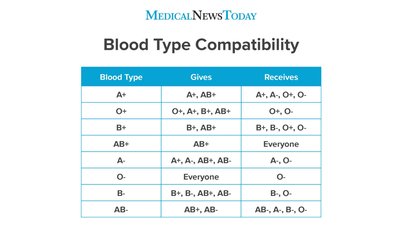
Example: ABO blood groups in humans.
Genotype | Phenotype |
|---|---|
IA/IA, IA/i | Blood Type A |
IB/IB, IB/i | Blood Type B |
IA/IB | Blood Type AB |
i/i | Blood Type O |
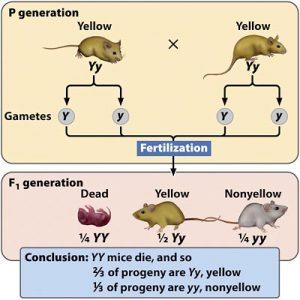
Lethal Alleles
Lethal alleles cause death when present in certain genotypes. They may be recessive or dominant.
Example: Yellow coat color in mice; Y/Y genotype is lethal, resulting in a 2:1 ratio instead of 3:1.
Genotype and Phenotype Variability
Penetrance and Expressivity
Individuals with the same genotype may show different phenotypes due to penetrance and expressivity.
Penetrance: Percentage of individuals expressing the expected phenotype.
Expressivity: Degree to which a phenotype is expressed.
Example: Some individuals with genotype AA may show variable phenotypes or none at all.
Gene by Gene Interactions
Multigene Pathways
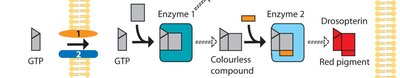
Multiple genes often act in concert to produce a phenotype, forming metabolic or developmental pathways.
Example: Drosophila eye pigment pathway involves several genes.
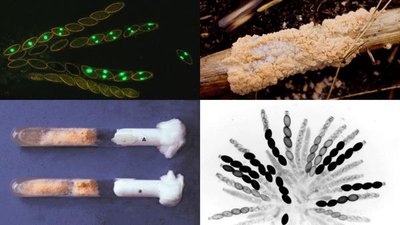
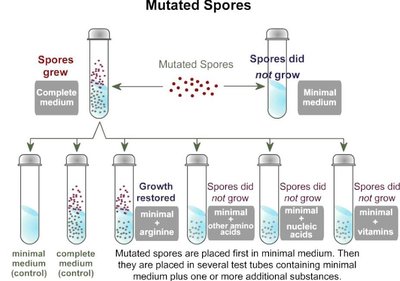
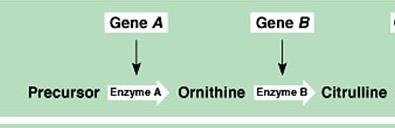
Beadle & Tatum's Experiments
Beadle and Tatum demonstrated gene interactions using Neurospora mutants, showing that each gene controls a step in a metabolic pathway.
Auxotrophic mutants: Require external nutrients due to loss of function in biosynthetic pathways.

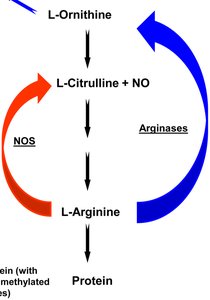
Mutant | Supplement: Ornithine | Supplement: Citrulline | Arginine |
|---|---|---|---|
Arg-1 | + | + | + |
Arg-2 | - | + | + |
Arg-3 | - | - | + |
Identifying Interactions Between Multiple Genes
Complementation Test
Complementation tests determine whether mutations affecting the same trait are in the same gene or different genes.
Cross homozygous mutants: If F1 shows wild-type phenotype, mutations are in different genes.
Mutant phenotype in F1: Mutations are alleles of the same gene.


Double Mutants and Phenotypic Ratios
Crossing F1 heterozygotes can reveal double mutants and unique phenotypic ratios, indicating gene interactions.
9:3:3:1 ratio: No interaction (null hypothesis).
9:7 ratio: Complementary gene interaction.
9:3:4 ratio: Recessive epistasis.
12:3:1 ratio: Dominant epistasis.

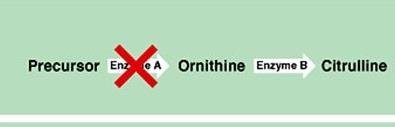
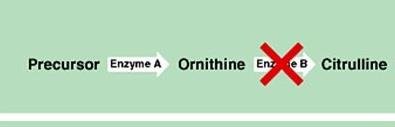
Complementary Gene Interaction (9:7 Ratio)
Two or more genes work together to produce a phenotype. Mutation in either gene disrupts the pathway.
Example: Citrulline production requires both genes A and B.
Epistasis
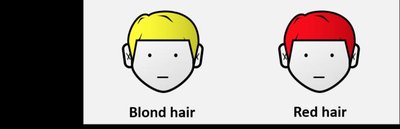
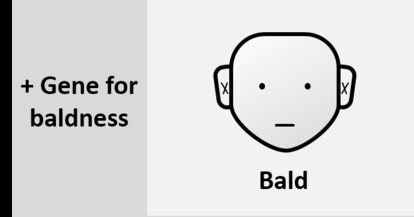
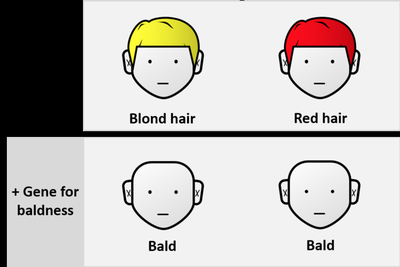
Epistasis occurs when the expression of one gene is affected or masked by another gene.
Example: Hair color gene expression is masked by a gene for baldness.

Recessive Epistasis (9:3:4 Ratio)
Recessive mutation in one gene blocks the expression of another gene's phenotype.
Example: Dog coat color: E gene determines pigment deposition, B gene determines pigment color. Recessive e/e blocks pigment.
Dominant Epistasis (12:3:1 Ratio)
Dominant mutation in one gene blocks the expression of another gene's phenotype.
Example: Gourd color: A gene controls pigment deposition, B gene controls pigment color. Dominant A blocks pigment regardless of B.
Summary Table: Gene Interaction Ratios
Ratio | Interaction Type |
|---|---|
9:3:3:1 | No interaction |
9:7 | Genes in same pathway (complementary) |
9:3:4 | Recessive epistasis |
12:3:1 | Dominant epistasis |
Additional info: These notes expand on the original lecture content by providing definitions, examples, and tables for clarity. All images included are directly relevant to the adjacent explanations and reinforce key genetic concepts.
