 Back
BackGene Mapping with Recombination: Principles and Applications
Study Guide - Smart Notes
 Tailored notes based on your materials, expanded with key definitions, examples, and context.
Gene Mapping with Recombination
Introduction to Gene Mapping
Gene mapping is a fundamental technique in genetics used to determine the relative positions of genes on a chromosome. This process relies on the principle of genetic recombination, which occurs during meiosis and results in the exchange of genetic material between homologous chromosomes. By analyzing the frequency of recombination events between genes, geneticists can estimate the physical distance between them and construct linkage maps.
Calculating Recombination Frequencies
Parental vs. Recombinant Offspring
To calculate recombination frequency, it is essential to distinguish between parental (nonrecombinant) and recombinant offspring. Parental offspring inherit the same combination of alleles as the parents, while recombinant offspring display new combinations due to crossing over.
Parental (Nonrecombinant) Offspring: Offspring with the same allele combinations as the original parents.
Recombinant Offspring: Offspring with new allele combinations resulting from crossing over between homologous chromosomes.
Recombination frequency is calculated using the formula:
One percent recombination is defined as one map unit, or one centimorgan (cM).
Interpreting Recombination Frequency
Relationship to Map Distance
The recombination frequency between two genes provides an estimate of their distance on a chromosome. For example, a recombination frequency of 0.36 (or 36%) means that 36% of the offspring are recombinants, and the genes are approximately 36 cM apart.
1% recombination = 1 cM
Recombination frequency is additive for closely linked genes.
Example: If genes A and B have a recombination frequency of 36%, they are 36 cM apart.
Converting Recombination Frequency to Physical Map Distance
Centimorgan (cM) as a Unit of Distance
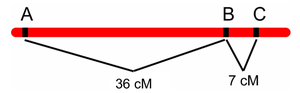
One centimorgan (cM) corresponds to a 1% crossover frequency between two genes. Genetic distances are additive, so the total distance between two genes separated by a third gene is the sum of the individual distances.
Distance between A and B: 36 cM
Distance between B and C: 7 cM
Distance between A and C: 36 + 7 = 43 cM
Steps for Building a Linkage Map
Step 1: Cross True-Breeding Parents
Begin by crossing two true-breeding (homozygous) parents to produce a dihybrid offspring (heterozygous for both genes).
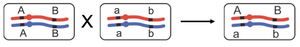
Step 2: Dihybrid Testcross
Cross the dihybrid with a homozygous recessive tester. This testcross allows for the detection of recombination events between the two genes.
Step 3: Count Offspring and Determine Linkage
Count the number of offspring for each phenotype and determine whether the genes are linked (on the same chromosome) or assort independently.
Step 4: Identify Recombinants and Nonrecombinants
Compare offspring phenotypes to parental types to identify which are recombinants and which are nonrecombinants.
Step 5: Calculate Recombination Frequency
Use the offspring counts to calculate the recombination frequency and estimate the genetic distance between the genes.
Gene Order and Linkage Analysis
Using Multiple Crosses to Infer Gene Order
By analyzing recombination frequencies from multiple crosses, the order of genes on a chromosome can be inferred. The gene order that best fits the observed recombination data is considered correct.
Limits of Recombination Frequency
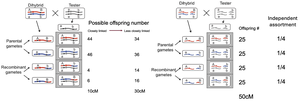
The 50% Limit
The maximum measurable recombination frequency is 50%. Genes that are more than 50 cM apart (or on different chromosomes) will assort independently, and their recombination frequency will not exceed 50%.
Genes farther than 50 cM apart behave as if unlinked.
Independent assortment occurs when recombination frequency is 50%.
How Increasing Distance Weakens Linkage
As the distance between two genes increases, the likelihood of recombination between them also increases, weakening the genetic linkage. When the distance reaches or exceeds 50 cM, the genes assort independently, and all possible gamete combinations occur with equal frequency.
Application Example: Dihybrid Testcross in Mice
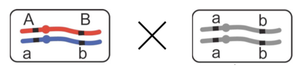
Allele Arrangement in Dihybrid Crosses
When studying linked genes, it is important to determine the arrangement of alleles in the dihybrid parent. For example, in a testcross involving hair type (H/h) and eye color (E/e) in mice, the arrangement of alleles on homologous chromosomes can be visualized as follows:
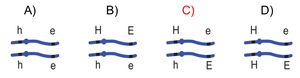
Correct identification of the parental and recombinant types is essential for accurate gene mapping.
Summary Table: Key Concepts in Gene Mapping
Concept | Definition | Example |
|---|---|---|
Recombination Frequency | Proportion of recombinant offspring among total offspring | 0.36 (36%) for genes A and B |
Centimorgan (cM) | Unit of genetic distance; 1% recombination = 1 cM | Genes A and B are 36 cM apart |
Linkage Map | Diagram showing the relative positions of genes on a chromosome | A–B: 36 cM, B–C: 7 cM, A–C: 43 cM |
50% Limit | Maximum measurable recombination frequency; indicates independent assortment | Genes on different chromosomes |
Additional info: The above notes integrate foundational concepts from chromosome mapping, recombination, and linkage analysis, as covered in college-level genetics courses. The examples and diagrams reinforce the practical application of these principles in genetic analysis and mapping.
