 Back
BackGenetic Interactions: Penetrance, Expressivity, Pleiotropy, and Epistasis
Study Guide - Smart Notes
 Tailored notes based on your materials, expanded with key definitions, examples, and context.
Genetic Interactions and Variable Phenotypes
Penetrance and Expressivity
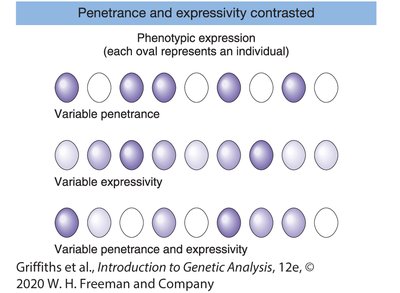
Genetic traits are often interpreted based on the assumption that genotype strictly determines phenotype. However, this relationship can be complicated by phenomena such as incomplete penetrance and variable expressivity.
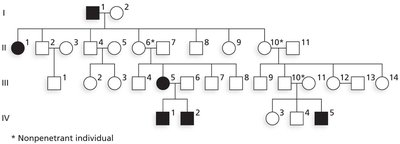
Penetrance: The proportion of individuals with a particular genotype who actually express the associated phenotype. Complete penetrance means every individual with the genotype shows the phenotype; incomplete penetrance means some do not.
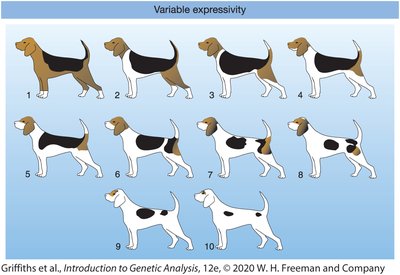
Expressivity: The degree or intensity with which a genotype is expressed in the phenotype. Variable expressivity means individuals with the same genotype may show the trait to different extents.
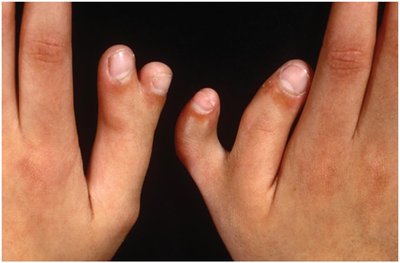
Example: Polydactyly (extra fingers/toes) is an autosomal dominant trait with incomplete penetrance; not all carriers show the phenotype.
Sex-Limited and Sex-Influenced Traits
Some traits are expressed only in one sex (sex-limited) or are influenced by sex (sex-influenced), often due to hormonal differences.
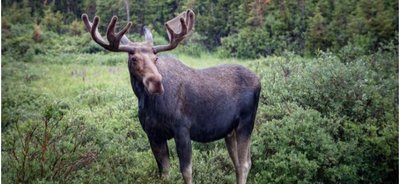
Sex-limited traits: Genes present in both sexes but expressed only in one. Example: Horn development in male moose, mammalian milk production.
Sex-influenced traits: Traits whose expression is affected by the sex of the individual.
Pleiotropy
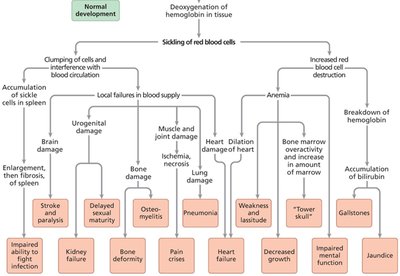
Pleiotropy occurs when a single gene affects multiple distinct traits. This is common in developmental genes and can lead to complex phenotypes.
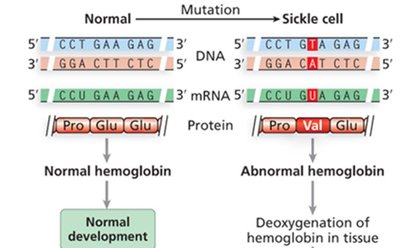
Example: Sickle cell disease is caused by a mutation in the β-globin gene, affecting red blood cell shape, anemia, and multiple organ systems.
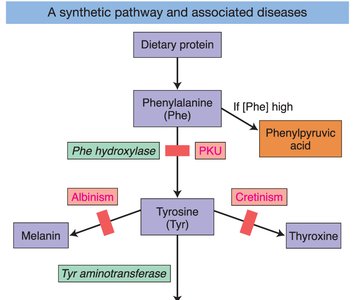
Gene Interaction and Epistasis
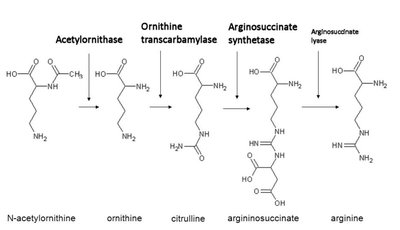
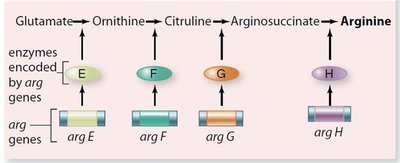
Genes rarely act alone; they interact in pathways to produce phenotypes. Gene interaction can modify Mendelian ratios, especially in multistep biochemical pathways.
Epistasis: Interaction between genes where the effect of one gene masks or modifies the effect of another. This leads to altered phenotypic ratios in dihybrid crosses.
Anabolic pathways: Biosynthesis of complex compounds.
Catabolic pathways: Breakdown of complex compounds.


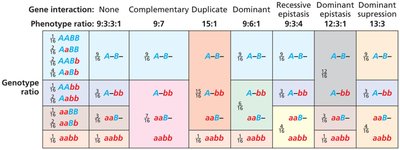
Epistatic Ratios in Dihybrid Crosses
Epistasis alters the expected 9:3:3:1 ratio in dihybrid crosses. Different types of epistasis produce characteristic ratios:
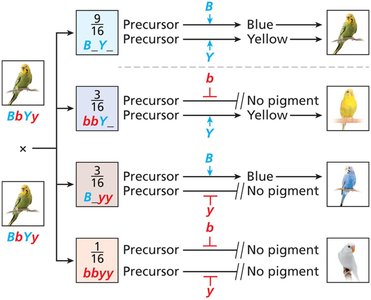
No gene interaction: 9:3:3:1 ratio (e.g., budgerigar feather color)
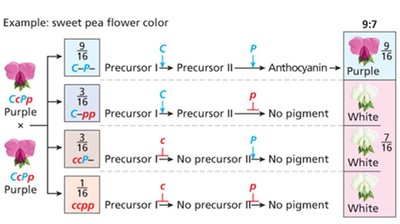
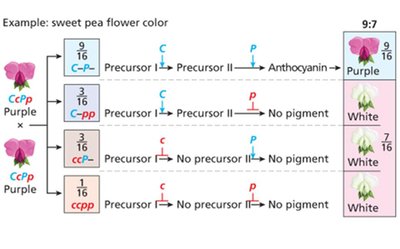
Complementary gene interaction: 9:7 ratio (both genes needed for phenotype, e.g., sweet pea flower color)
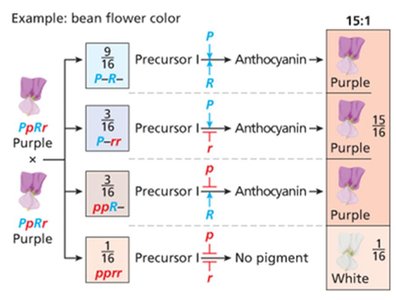
Duplicate gene action: 15:1 ratio (either gene can produce phenotype, e.g., bean flower color)
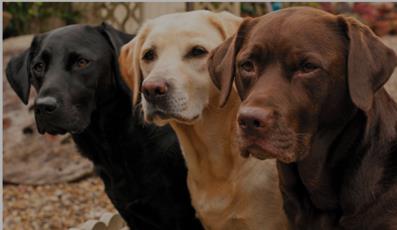
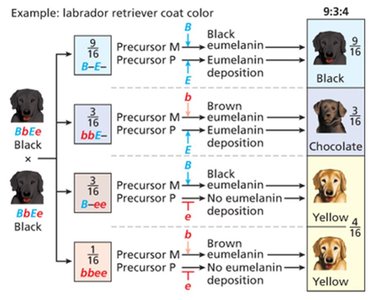
Recessive epistasis: 9:3:4 ratio (recessive allele at one locus masks another, e.g., Labrador retriever coat color)
Dominant gene interaction: 9:6:1 ratio (dominant alleles at both loci needed for wild type, e.g., summer squash fruit shape)


Complementation Analysis
Complementation analysis distinguishes whether mutations causing similar phenotypes are in the same gene or different genes.
Genetic heterogeneity: Mutations in different genes can produce similar phenotypes.
Complementation test: Cross two mutants. If offspring are wild type, mutations are in different genes (complementation occurs). If offspring are mutant, mutations are in the same gene (no complementation).
Complementation group: Mutations that fail to complement each other are grouped as affecting the same gene.
Example: Multiple crosses with pure-breeding mutants can reveal the number of genes involved in a phenotype.
Summary Table: Epistatic Ratios
Gene Interaction | Phenotype Ratio | Example |
|---|---|---|
None | 9:3:3:1 | Budgerigar feather color |
Complementary | 9:7 | Sweet pea flower color |
Duplicate | 15:1 | Bean flower color |
Recessive epistasis | 9:3:4 | Labrador retriever coat color |
Dominant interaction | 9:6:1 | Summer squash fruit shape |
Key Equations
Chi-square test for genetic ratios: Where O = observed, E = expected.
Additional info:
Genetic counseling is complicated by variable penetrance and expressivity, as predicting phenotype from genotype is not always straightforward.
Environmental effects can further modify genetic expression, adding complexity to phenotype prediction.
