 Back
BackGenetic Linkage and Mapping in Eukaryotes
Study Guide - Smart Notes
 Tailored notes based on your materials, expanded with key definitions, examples, and context.
Genetic Linkage and Mapping
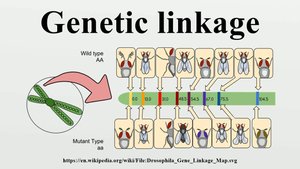
Introduction to Genetic Linkage
Genetic linkage refers to the phenomenon where genes that are located close together on the same chromosome tend to be inherited together. This is a fundamental concept in genetics, as it affects the assortment of alleles and the genetic variation observed in offspring.
Syntenic genes: Genes located on the same chromosome.
Linked genes: Syntenic genes that are so close together that their alleles do not assort independently during meiosis.
Genetic linkage can be quantified and used to map the positions of genes on chromosomes.
Recombination and Syntenic Genes
Recombination, or crossing over, can occur between homologous chromosomes during meiosis, resulting in new combinations of alleles. However, the closer two genes are, the less likely recombination will occur between them.
Parental chromosomes: Chromosomes that retain the original combination of alleles.
Recombinant chromosomes: Chromosomes that have undergone crossing over, resulting in new allele combinations.
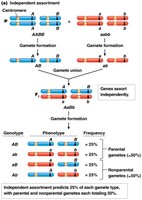
Independent Assortment vs. Linkage
Genes that are far apart on the same chromosome or on different chromosomes assort independently, while closely linked genes do not.
Independent assortment occurs when genes are far apart, leading to frequent recombination.
Linked genes segregate together more often because crossing over between them is rare.
Crossing over occurs during Prophase I of meiosis.
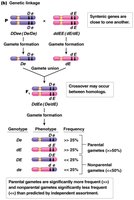
Observations and Detection of Genetic Linkage
Genetic linkage is detected by comparing observed frequencies of gamete genotypes or progeny phenotypes with those expected under independent assortment.
Parental allele combinations are observed at higher frequencies than predicted by chance if genes are linked.
Recombinant types are less frequent than expected.
Gametes of Dihybrids: Unlinked vs. Linked Genes
In dihybrid crosses, the assortment of gametes differs depending on whether the genes are linked or unlinked.
Unlinked genes (e.g., AaBb x AaBb): Four gamete types (AB, Ab, aB, ab) are produced in equal frequency.
Linked genes (e.g., DDee x ddEE): Parental combinations (De and dE) occur more than 50% of the time; recombinant combinations (DE and de) occur less than 50%.
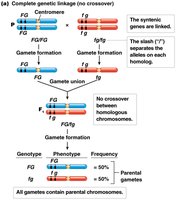
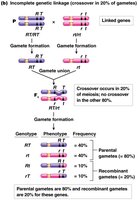
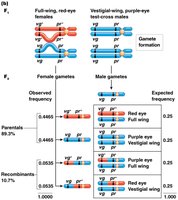
Complete vs. Incomplete Genetic Linkage
Complete genetic linkage occurs when no crossing over happens between linked genes, resulting in only parental gametes. Incomplete linkage, which is more common, produces both parental and recombinant gametes, but parental types predominate.
Complete linkage: Only parental gametes are formed (e.g., Drosophila males).
Incomplete linkage: Both parental and recombinant gametes are produced, with parental types being more frequent.
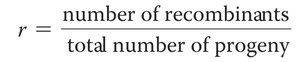
Calculating Recombination Frequency
Recombination frequency (r) is a measure of the proportion of recombinant offspring produced in a cross and reflects the physical distance between genes.
Formula:
Higher recombination frequency indicates greater distance between genes.
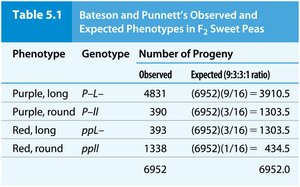
Historical Discovery of Genetic Linkage
Bateson and Punnett discovered genetic linkage through crosses in sweet peas, observing deviations from expected Mendelian ratios. Morgan extended these findings in Drosophila, using test-cross analysis to interpret linkage and recombination.
Parental phenotypes were observed more frequently than expected.
Nonparental (recombinant) types were less frequent.
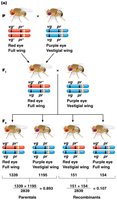
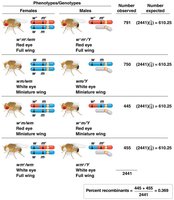
Test-Cross Analysis and Linkage Mapping
Test-cross analysis is used to detect linkage and map genes. In Drosophila, Morgan used crosses involving visible mutations to demonstrate linkage and calculate recombination frequencies.
Test cross: Cross between a heterozygote and a homozygous recessive individual.
Allows direct observation of recombinant and parental gametes from the heterozygote.
Genetic Linkage Mapping
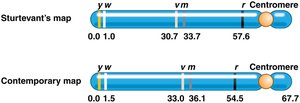
Genetic linkage mapping uses recombination frequencies to estimate the distances between genes on a chromosome. The unit of measurement is the map unit (m.u.) or centimorgan (cM), where 1% recombination equals 1 m.u. or 1 cM.
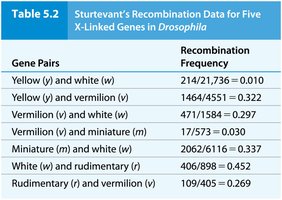
Sturtevant created the first genetic map using recombination data from Drosophila.
Gene order and distances can be inferred from recombination frequencies.
Chi-Square Analysis of Linkage Data
Chi-square analysis is used to determine if the observed deviation from expected Mendelian ratios is statistically significant, indicating genetic linkage.
Expected values are based on independent assortment.
Significant deviation (p < 0.05) supports linkage.
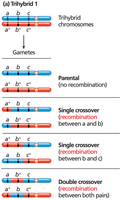
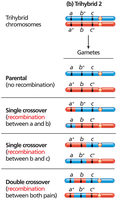
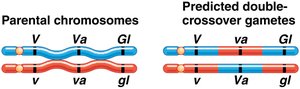
Three-Point Test-Cross Analysis
Three-point test-cross analysis allows simultaneous mapping of three linked genes and determination of their order on the chromosome. Parental types are most frequent, single crossovers are less frequent, and double crossovers are least frequent.
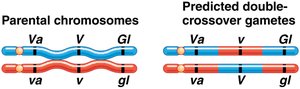
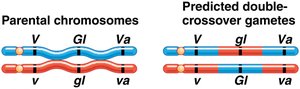
Double-crossover progeny help determine the gene order.
Recombination frequencies between each gene pair are calculated to construct the map.
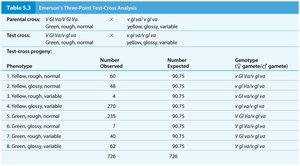
Determining Gene Order and Map Distances
Gene order is determined by comparing parental and double-crossover genotypes. The gene that differs between these is in the middle. Map distances are calculated by adding single and double crossovers and dividing by the total number of progeny.
Double crossovers are used to refine map distances and gene order.
Interference and Coincidence
Interference is the phenomenon where the occurrence of one crossover reduces the probability of another crossover nearby. The coefficient of coincidence is used to measure this effect.
Observed double crossovers are often fewer than expected.
Interference (I) = 1 - (observed double crossovers / expected double crossovers).
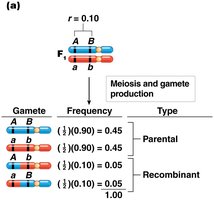
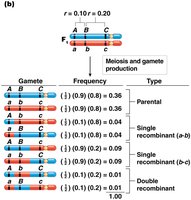
Predicting Gamete Frequencies from Genetic Maps
Genetic maps allow prediction of gamete frequencies in crosses involving two or three genes. For two genes, the frequency of recombinant gametes equals the map distance. For three genes, probabilities are calculated for each crossover class.
For two genes A and B, 10 cM apart: 5% each recombinant, 45% each parental.
For three genes A, B, and C, with distances 10 cM (A-B) and 20 cM (B-C):
Gamete Type | Frequency |
|---|---|
ABC, abc (parental) | 0.36 each |
Abc, aBC (single crossover A-B) | 0.04 each |
ABc, abC (single crossover B-C) | 0.09 each |
AbC, aBc (double crossover) | 0.01 each |
Additional info: The above notes integrate foundational concepts, historical experiments, and practical calculations for genetic linkage and mapping, as covered in a typical college genetics course.
