 Back
Genetic Linkage and Mapping in Eukaryotes: Study Notes
Study Guide - Smart Notes
 Tailored notes based on your materials, expanded with key definitions, examples, and context.
Genetic Linkage and Mapping in Eukaryotes
Introduction to Genetic Linkage and Mapping
Genetic linkage refers to the tendency of genes located close together on the same chromosome to be inherited together. Mapping these genes allows geneticists to determine their relative positions and distances on chromosomes, which is fundamental for understanding inheritance patterns and recombination.
Thomas Hunt Morgan established the chromosome theory of inheritance and explained genetic linkage and recombination.
Linkage and recombination are key concepts in genetic mapping.
Linked Genes and Synteny
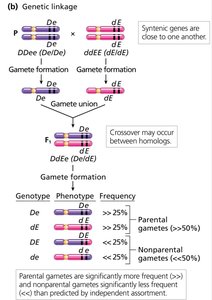
Genes located on the same chromosome are called syntenic genes. If syntenic genes are close enough that their alleles do not assort independently, they are termed linked genes.
Genetic linkage can be quantified to map gene positions.
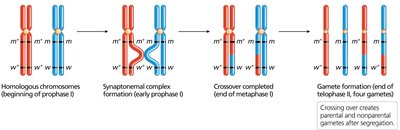
Crossing over between homologous chromosomes can reshuffle alleles, producing recombinant chromosomes.
Homologs that do not reshuffle alleles are called parental chromosomes or nonrecombinant chromosomes.
Independent Assortment vs. Genetic Linkage
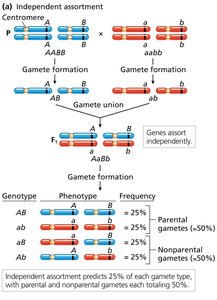
Independent assortment occurs when genes are far apart on a chromosome, leading to frequent recombination. Linked genes tend to segregate together unless crossing over occurs during prophase I of meiosis.
Linked genes produce more parental allele combinations than nonparental combinations.
Crossing over is less likely between closely linked genes.
Complete and Incomplete Genetic Linkage
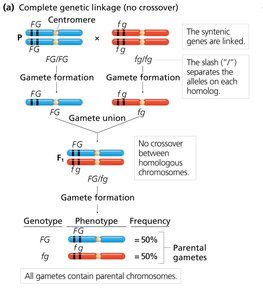
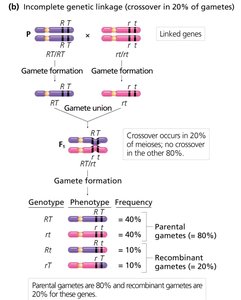
Complete genetic linkage occurs when no crossing over happens between linked genes, resulting in only parental gametes. Incomplete linkage, which is more common, produces both parental and recombinant gametes.
Complete linkage: Only parental types are produced (e.g., Drosophila males).
Incomplete linkage: Both parental and recombinant types are produced, with frequencies varying by gene pair.
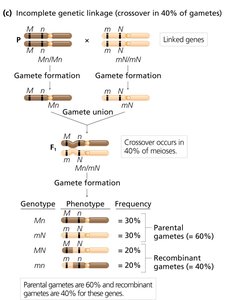
Recombination Frequency and Gene Distance
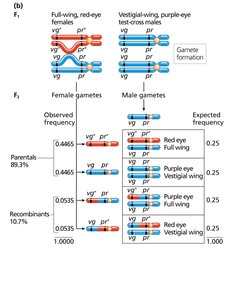
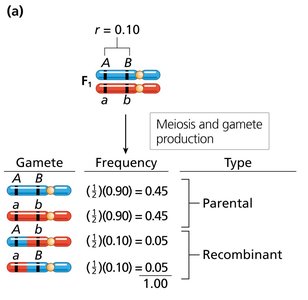
Recombination frequency (r) is calculated as the number of recombinants divided by the total number of progeny. It reflects the physical distance between two genes.
Higher recombination frequency indicates greater distance between genes.
Lower recombination frequency indicates genes are closer together.
Formula:
Historical Evidence and Experiments
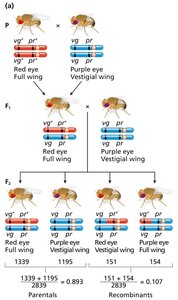
Bateson and Punnett's sweet pea crosses and Morgan's Drosophila experiments provided evidence for genetic linkage. Observed ratios deviated from expected Mendelian ratios, indicating linkage.
Parental phenotypes were more frequent than expected.
Nonparental types were less frequent.
Morgan's Analysis of X-Linked Genes
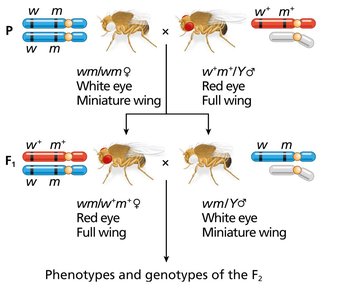
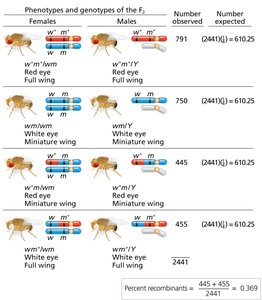
Morgan studied the linkage of eye color and wing form genes in Drosophila, demonstrating that nonparental allele combinations resulted from recombination between X chromosomes in heterozygous females.
Test-Cross Analysis for Autosomal Linkage
Test-cross analysis allows detection of autosomal genetic linkage by examining the progeny phenotypes contributed by the dihybrid parent.
Cytological Evidence of Recombination
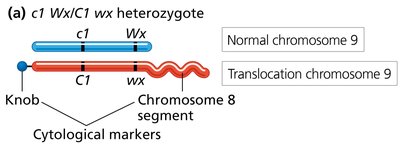
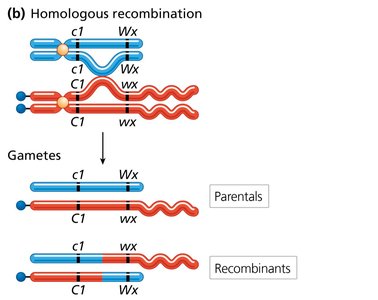
Creighton and McClintock (corn) and Stern (fruit flies) provided direct evidence that recombination is accompanied by physical exchange between homologous chromosomes.
Genetic Linkage Mapping and Map Units
Recombination frequencies can be used to construct genetic maps. Map units (m.u.) or centiMorgans (cM) represent the distance between genes, with 1% recombination equaling 1 cM.
Sturtevant created the first genetic map using recombination data from Drosophila.
Table: Sturtevant’s Recombination Data
Gene Pair | Recombination Frequency (r) |
|---|---|
Yellow (y) and white (w) | 0.010 |
Yellow (y) and vermilion (v) | 0.322 |
Vermilion (v) and white (w) | 0.297 |
Vermilion (v) and miniature (m) | 0.030 |
Miniature (m) and white (w) | 0.337 |
White (w) and rudimentary (r) | 0.452 |
Rudimentary (r) and vermilion (v) | 0.269 |
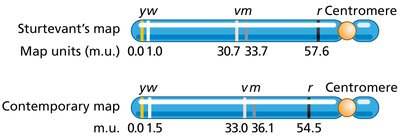
Chi-Square Analysis of Linkage Data
Chi-square tests are used to determine if observed ratios significantly deviate from expected ratios under independent assortment, indicating linkage.
Formula:
Three-Point Test-Cross Analysis
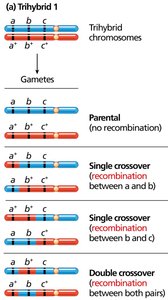
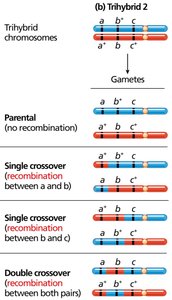
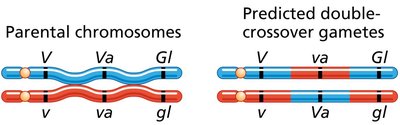
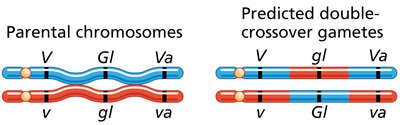
Three-point test-crosses allow efficient mapping of three linked genes simultaneously. Parental, single-crossover, and double-crossover gametes can be identified, and their frequencies analyzed.
Constructing Three-Point Recombination Maps
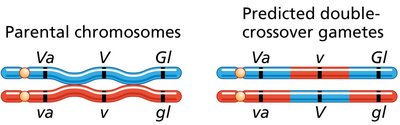
Three-point test-crosses, such as Emerson's maize experiment, help determine gene order and recombination frequencies. Double-crossover progeny are used to establish gene order.
Gene order is determined by comparing parental alleles and double-crossover genotypes.
Calculating Recombination Frequencies and Interference
Recombination frequencies are calculated for each gene pair, and interference is assessed by comparing observed and expected double crossovers.
Coefficient of coincidence (c): Ratio of observed to expected double crossovers.
Interference (I):
Predicting Gamete Frequencies from Genetic Maps
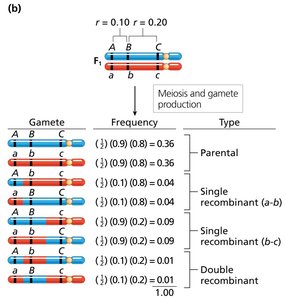
Genetic maps can be used to predict frequencies of recombinant and parental gametes based on map distances.
Correction of Genetic Map Distances
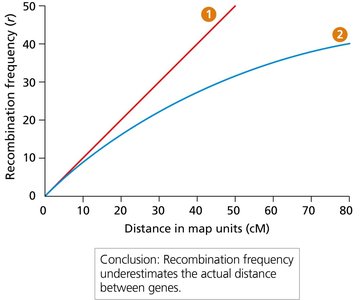
Map distances calculated from recombination frequencies may underestimate actual physical distances, especially for genes far apart. Mapping functions (Haldane, Kosambi) are used to correct these distances.
Factors Affecting Recombination Frequency
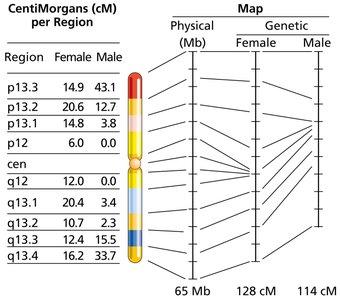
Species, age, environment, and sex can influence recombination frequency. For example, recombination rates differ between males and females, and are affected by temperature and diet in fruit flies.
Recombination Hotspots and Coldspots
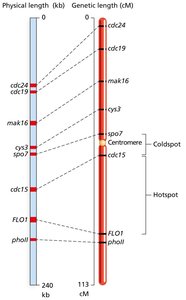
Recombination occurs at specific hotspots and coldspots within genomes, affecting the placement of genes on recombination maps compared to physical maps.
Human Gene Mapping and Linkage Groups
Mapping human genes is challenging due to limited controlled matings and offspring numbers. Polymorphic DNA sequences (genetic markers) and linkage groups facilitate mapping efforts.
Linkage groups are clusters of syntenic genes linked to one another.
Linkage between a marker and a gene assigns the linkage group to a chromosomal location.
