 Back
BackGenetic Linkage and Mapping in Eukaryotes – Study Notes
Study Guide - Smart Notes
 Tailored notes based on your materials, expanded with key definitions, examples, and context.
Genetic Linkage and Mapping in Eukaryotes
Introduction to Genetic Linkage
Genetic linkage refers to the phenomenon where genes that are located close to each other on the same chromosome tend to be inherited together. This concept is fundamental to understanding how traits are passed from one generation to the next and is a cornerstone of genetic mapping in eukaryotes.
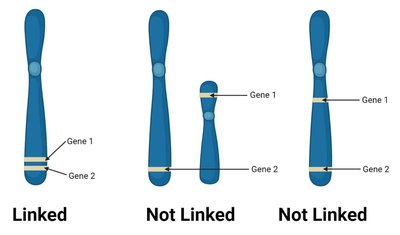
Syntenic genes: Genes located on the same chromosome.
Linked genes: Syntenic genes that are so close together that their alleles do not assort independently during meiosis.
Genetic linkage can be quantified and used to map the positions of genes on chromosomes.
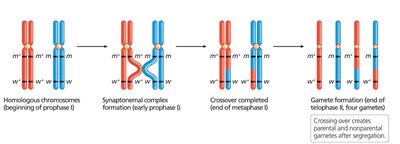
Mechanism of Recombination and Linkage
During meiosis, crossing over between homologous chromosomes can reshuffle alleles of syntenic genes, producing recombinant chromosomes. However, the closer two genes are, the less likely a crossover will occur between them, resulting in genetic linkage.
Parental (nonrecombinant) chromosomes: Homologs that do not reshuffle alleles under study.
Recombinant chromosomes: Chromosomes that result from crossing over and contain new combinations of alleles.
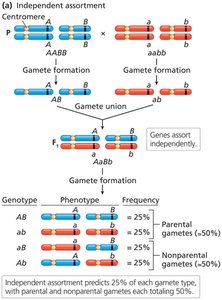
Independent Assortment vs. Genetic Linkage
Genes that are far apart on the same chromosome or on different chromosomes assort independently due to frequent recombination. In contrast, closely linked genes tend to be inherited together.
Independent assortment occurs when genes are far apart or on different chromosomes.
Linked genes segregate together unless separated by crossing over during prophase I of meiosis.
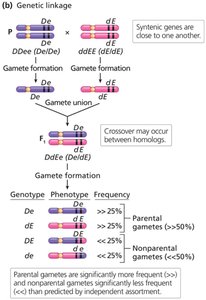
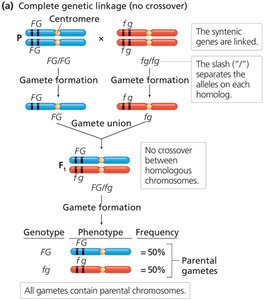
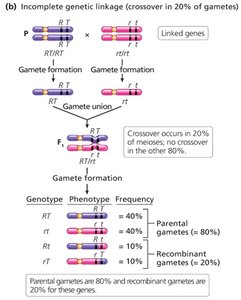
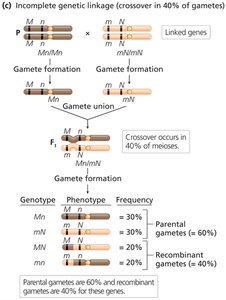
Complete and Incomplete Genetic Linkage
Genetic linkage can be complete or incomplete, depending on whether crossing over occurs between linked genes.
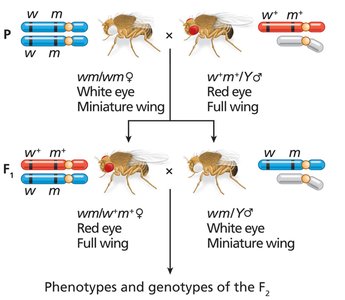
Complete linkage: No crossing over occurs; only parental gametes are formed (e.g., Drosophila males).
Incomplete linkage: Both parental and recombinant gametes are produced; the proportion of each depends on the distance between genes.
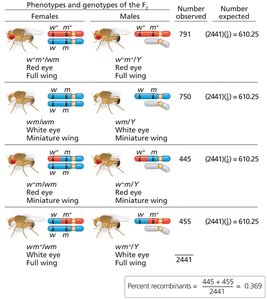
Calculating Recombination Frequency
Recombination frequency (r) is a measure of the proportion of recombinant offspring produced in a cross and reflects the physical distance between two genes.
Formula:
Higher recombination frequency indicates greater distance between genes.
Historical Experiments in Genetic Linkage
Early experiments by Bateson, Punnett, and Morgan provided evidence for genetic linkage and recombination.
Bateson and Punnett observed deviations from expected Mendelian ratios in sweet pea crosses, suggesting linkage.
Morgan's work with Drosophila established the chromosome theory of inheritance and the physical basis of linkage.
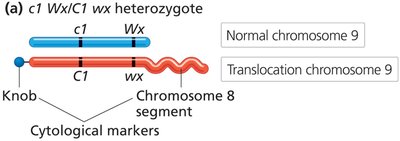
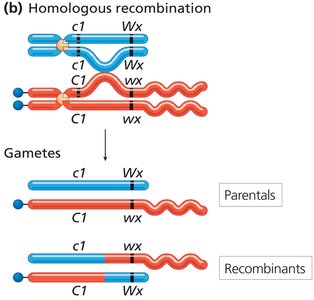
Cytological Evidence for Crossing Over
Direct evidence for the physical exchange of chromosome segments during recombination was provided by Creighton and McClintock in corn and Stern in fruit flies.
Structural markers on chromosomes allowed visualization of crossing over events.
Genetic Linkage Mapping
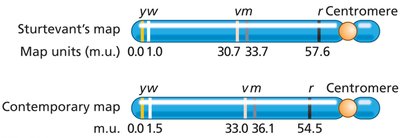
Genetic linkage mapping uses recombination frequencies to determine the relative positions of genes on chromosomes. The first genetic map was constructed by Alfred Sturtevant using Drosophila data.
Map units (m.u.) or centiMorgans (cM) are used to express genetic distances: 1% recombination = 1 cM.
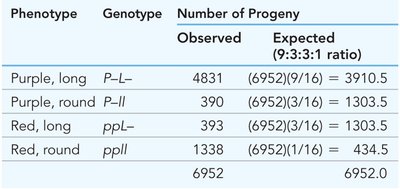
Statistical Analysis of Linkage Data
Chi-square analysis is used to determine if the observed frequencies of parental and recombinant phenotypes deviate significantly from those expected under independent assortment.
Significant deviation supports the presence of genetic linkage.
Factors Affecting Recombination Frequency
Recombination frequency can be influenced by species, age, environment, and sex. For example, recombination rates differ between males and females, and environmental factors such as temperature and diet can also have an effect.
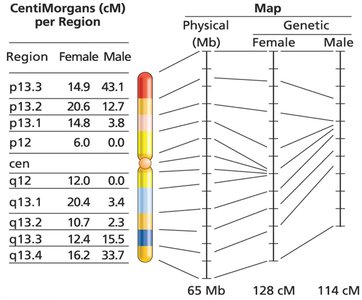
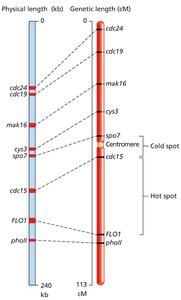
Recombination Hotspots and Coldspots
Recombination does not occur uniformly across the genome. Certain regions, called hotspots, have high rates of recombination, while coldspots have low rates. This can affect the accuracy of genetic maps.
Mapping Human Genes with Genetic Markers
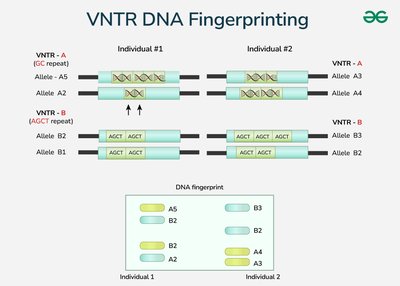
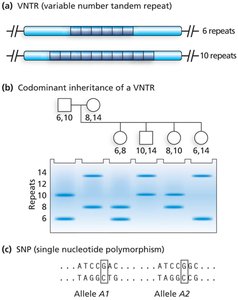
Human gene mapping relies on polymorphic DNA sequences known as genetic markers, which are typically found in noncoding regions. Common types of markers include VNTRs, SNPs, and RFLPs.
VNTRs (Variable Number Tandem Repeats): Short DNA sequences repeated end-to-end; repeat number varies among individuals.
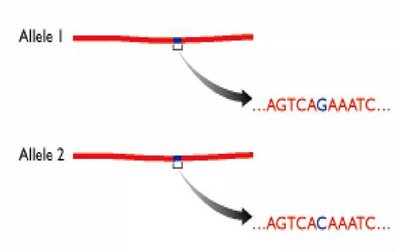
SNPs (Single Nucleotide Polymorphisms): Single base pair changes; highly abundant in the genome.
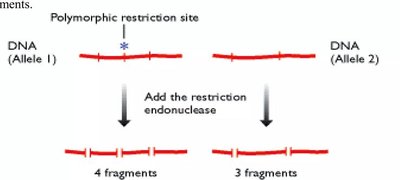
RFLPs (Restriction Fragment Length Polymorphisms): Variations detected by restriction enzymes cutting DNA at specific sequences.
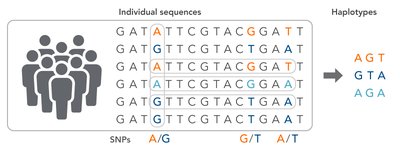
Haplotypes and Disease Gene Mapping
A haplotype is a specific combination of SNPs in a region of a chromosome. Closely linked SNPs tend to be inherited together, and their association with disease alleles can be used to map disease genes.
Lod Score Analysis
Lod (logarithm of the odds) score analysis is a statistical method used to evaluate the probability of genetic linkage in pedigrees. A lod score of 3.0 or higher is considered significant evidence for linkage.
Lod score formula:
Genome-Wide Association Studies (GWAS)
GWAS is a powerful approach for identifying genes associated with complex traits by scanning the genome for associations between SNP haplotypes and phenotypes in populations.
Results are often displayed as Manhattan plots, where the strength of association is indicated by the height of the bars.
Linkage Equilibrium and Disequilibrium
In populations, alleles at different loci are expected to be inherited independently (linkage equilibrium). When certain combinations of alleles are inherited together more or less often than expected, this is called linkage disequilibrium.
Linkage disequilibrium can help locate genes contributing to traits or diseases.
Evolutionary Implications of Linkage Disequilibrium
Linkage disequilibrium can arise from migration or natural selection favoring certain alleles. Evolutionary analysis can trace the origins and spread of alleles, such as the sickle cell allele in human populations.
Additional info: These notes provide a comprehensive overview of genetic linkage and mapping in eukaryotes, integrating historical context, experimental evidence, and modern applications in human genetics and genomics.
