 Back
BackGenetic Linkage and Mapping in Eukaryotes: Principles, Methods, and Applications
Study Guide - Smart Notes
 Tailored notes based on your materials, expanded with key definitions, examples, and context.
Genetic Linkage and Mapping in Eukaryotes
Introduction to Genetic Mapping
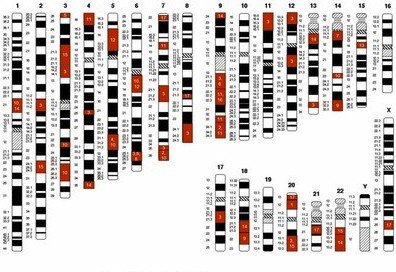
Genetic mapping, also known as gene or chromosome mapping, is a fundamental technique in genetics used to determine the linear order and relative distances of linked genes along chromosomes. This process is essential for understanding genetic organization, evolutionary relationships, and for applications in gene cloning, disease diagnosis, and selective breeding.
Genetic map: A diagram showing the relative positions of genes on a chromosome.
Locus: The specific physical location of a gene on a chromosome.
Applications: Genetic maps are used to clone genes, diagnose inherited diseases, predict inheritance risks, and improve agricultural strains.
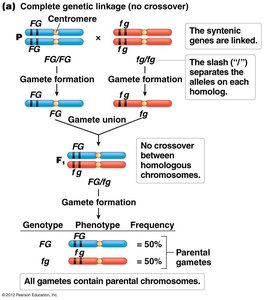
Linked Genes and Synteny
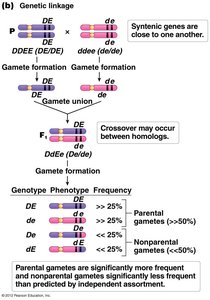
Genes located on the same chromosome are referred to as syntenic genes. When these genes are close together, their alleles do not assort independently, and are termed linked genes. Genetic linkage can be quantified to map gene positions.
Syntenic genes: Genes found on the same chromosome.
Linked genes: Syntenic genes whose alleles are inherited together due to their proximity.
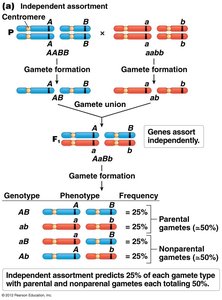
Independent assortment: Occurs when genes are far apart or on different chromosomes, leading to frequent recombination.
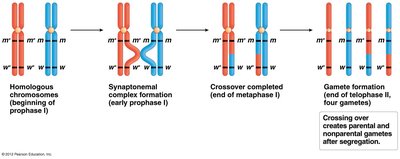
Recombination and Genetic Linkage
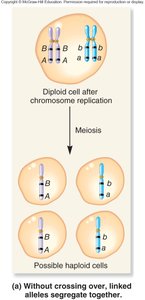
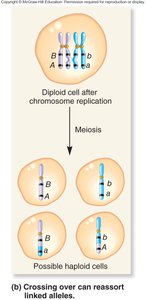
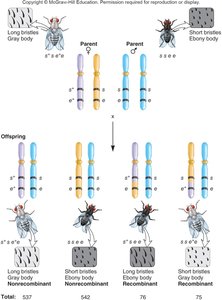
Recombination occurs when crossing over between homologous chromosomes reshuffles alleles, producing recombinant chromosomes. Parental chromosomes retain the original allele combinations, while recombinant chromosomes have new combinations.
Parental chromosomes: Chromosomes that retain the original allele arrangement.
Recombinant chromosomes: Chromosomes with new allele combinations due to crossing over.
Crossing over: Occurs during prophase I of meiosis, reshuffling alleles between homologs.
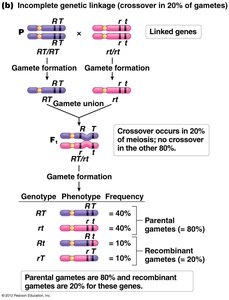
Quantifying Genetic Linkage: Recombination Frequency and Map Units
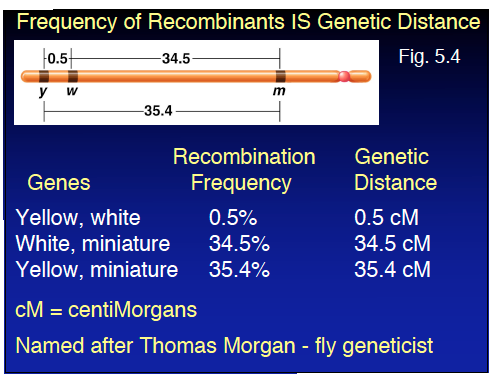
The frequency of recombinant offspring is correlated with the distance between genes. The greater the distance, the higher the recombination frequency. Genetic distance is measured in map units (mu) or centiMorgans (cM), where 1 cM equals 1% recombination frequency.
Map distance formula:
Example: If 76 + 75 recombinant offspring are observed out of 542 + 537 + 76 + 75 total offspring, the map distance is 12.3 cM.
Single vs. Double Crossovers
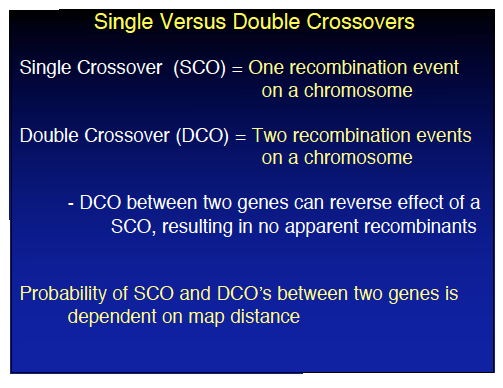
Crossovers can occur once (single crossover, SCO) or twice (double crossover, DCO) between genes. DCOs can reverse the effect of SCOs, resulting in no apparent recombinants. The probability of SCO and DCO depends on the map distance between genes.
Single crossover (SCO): One recombination event between two genes.
Double crossover (DCO): Two recombination events, potentially reversing the effect of a single crossover.
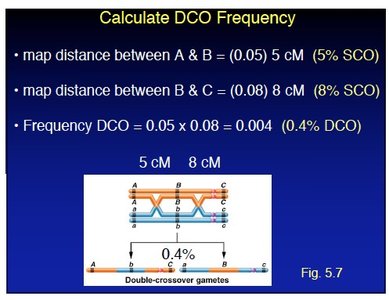
For example, if the map distance between A and B is 5 cM (5% SCO) and between B and C is 8 cM (8% SCO), then DCO frequency is (0.4% DCO).
Testcrosses and Genetic Mapping Experiments
Genetic mapping is often performed using a testcross, where a heterozygous individual is crossed with a homozygous recessive individual. The resulting offspring are analyzed to determine recombination frequencies and map distances.
Testcross: Mating between a heterozygote and a homozygous recessive individual.
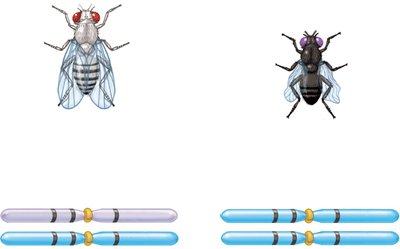
Example: In fruit flies, crossing individuals with different bristle length and body color alleles allows mapping of these genes.
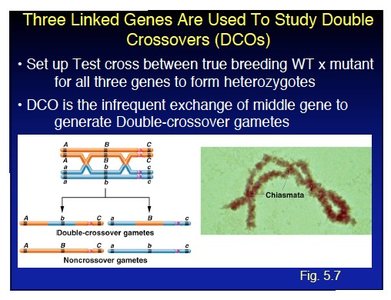
Three-Factor Crosses and Gene Order Determination
Three-factor crosses provide information about gene order and map distances. By crossing true-breeding strains differing in three alleles and analyzing the F2 generation, the order and distances between genes can be determined.
Gene order: Determined by analyzing double crossover phenotypes, which separate the middle gene from the others.
Example: In fruit flies, body color, eye color, and wing shape genes can be mapped using three-factor crosses.


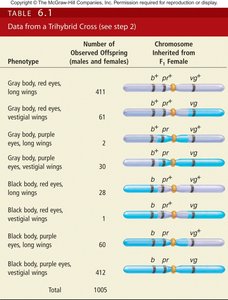
Calculating Map Distances from Three-Factor Crosses
Map distances between pairs of genes are calculated by regrouping offspring data into parental and nonparental combinations. The formula for map distance is applied to each gene pair.
Example calculations:
Gene Pair | Map Distance |
|---|---|
Body color & Eye color | 6.1 cM |
Body color & Wing shape | 17.8 cM |
Eye color & Wing shape | 12.3 cM |
The gene for eye color is located between the genes for body color and wing shape, as determined by double crossover analysis.


Constructing Genetic Maps
Genetic maps are constructed by placing genes in order based on calculated map distances. The gene order is consistent with the observed recombination frequencies and double crossover data.
Example: The map for body color, eye color, and wing shape is drawn as vg – pr – b, with distances of 6.1 cM and 12.3 cM between adjacent genes.

Summary Table: Genetic Mapping Concepts
Concept | Definition | Example/Application |
|---|---|---|
Syntenic genes | Genes on the same chromosome | Linked genes in fruit flies |
Linked genes | Genes inherited together due to proximity | Body color and bristle length |
Recombination frequency | Proportion of recombinant offspring | 12.3% for s and e genes |
Map unit (cM) | 1% recombination frequency | Distance between genes |
Testcross | Heterozygote x homozygous recessive | Mapping in fruit flies |
Three-factor cross | Cross involving three genes | Gene order determination |
Additional info: These notes expand on the lecture content by providing definitions, formulas, and examples for key concepts in genetic linkage and mapping, suitable for exam preparation and self-study.
