 Back
BackGenetic Linkage and Mapping: Study Guide for College Genetics
Study Guide - Smart Notes
 Tailored notes based on your materials, expanded with key definitions, examples, and context.
Genetic Linkage and Mapping
Introduction to Genetic Linkage
Genetic linkage refers to the phenomenon where genes located close together on the same chromosome tend to be inherited together, rather than assorting independently. This concept is fundamental to understanding how traits are passed from one generation to the next and forms the basis for genetic mapping.
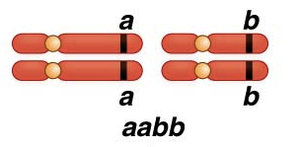
Independent Assortment: Genes on different chromosomes or far apart on the same chromosome assort independently.
Linkage: Genes close together on the same chromosome do not segregate independently and are said to be linked.
Parental vs. Nonparental Gametes: When genes are linked, parental gametes are more frequent than nonparental (recombinant) gametes.
Mechanism of Linkage: Meiosis and Crossing Over
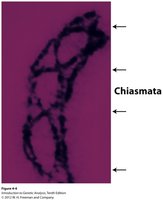
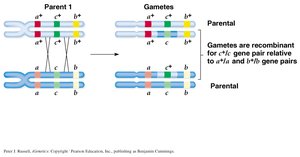
Linkage is explained by the events of meiosis, particularly during prophase I, when homologous chromosomes pair and crossing-over occurs.
Crossing Over: Exchange of genetic material between non-sister chromatids leads to recombination.
Chiasmata: Physical sites where crossing-over occurs.
Types of Linkage Relationships
There are three main cases for gene relationships:
Independent Assortment: No linkage; genes on different chromosomes or far apart.
Complete Linkage: No recombination; genes are inherited together.
Incomplete Linkage: Some recombination occurs due to crossing-over between genes on non-sister chromatids.
Linkage and Recombination Frequency
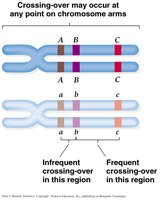
The frequency of recombination between two genes is used to estimate their distance on a chromosome.
Map Unit (mu) or CentiMorgan (cM): 1 map unit = 1% recombination.
Formula:
Closer Genes: Lower recombination frequency.
Further Genes: Higher recombination frequency.
Testcrosses and Linkage Analysis
Testcrosses are used to analyze linkage and determine gene distances.
Dihybrid Testcross: Two nonrecombinant classes (parentals) are more than 50% of total; two recombinant classes are less than 50%.
Single Cross-Over (SCO): Used to determine distance between two genes.
Double Cross-Over (DCO): Used to determine order and distance among three genes.
Three-Point Testcrosses and Gene Mapping
Three-point testcrosses allow determination of gene order and distances.
Most Frequent Phenotypes: Parental configuration.
Least Frequent Phenotypes: Double crossovers; help identify the middle gene.
Gene Order: Determined by comparing DCOs to parentals.
Map Distance Calculation: Total crossovers (SCOs + DCOs) between two genes.
Interference and Coefficient of Coincidence
Interference: Occurs when a crossover in one region affects the likelihood of a crossover in an adjacent region.
Coefficient of Coincidence (CC):
Interference:
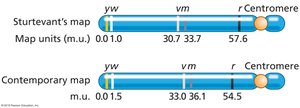
Genetic Maps: Historical and Contemporary
Genetic maps are constructed using recombination frequencies.
Sturtevant's Map: Early genetic map of Drosophila X chromosome.
Contemporary Map: Updated with more accurate distances.
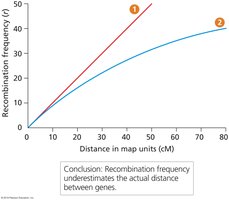
Recombination vs. Physical Distance
Recombination frequency does not always perfectly reflect physical distance, especially for genes far apart.
Underestimation: Recombination rates underestimate physical distances beyond about 8 cM due to multiple crossover events.
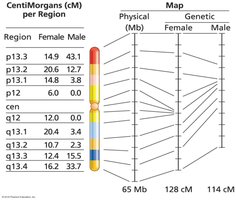
Variations in Recombination Rates
Recombination rates can vary by sex, species, and environmental factors.
Drosophila: Recombination only occurs in females.
Humans: Recombination rate is higher in females than males.
Environmental Effects: Temperature, nutrition, etc., can affect recombination rates.
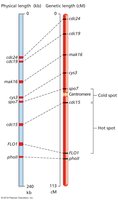
Recombination Hotspots and Coldspots
Recombination probabilities are not equal across a chromosome; some regions are hotspots, others are coldspots.
Hotspots: Regions with high recombination frequency.
Coldspots: Regions with low recombination frequency.
Genetic Markers for Mapping
Genetic markers are used to track inheritance and map genes.
Variable Number of Tandem Repeats (VNTRs): Repeated DNA sequences.
Single Nucleotide Polymorphisms (SNPs): Single base pair variations.
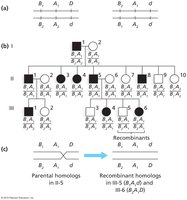
Haplotype Inheritance: Tracking disease alleles using adjacent SNPs.
Mapping Genes in Humans: Pedigree Analysis and Lod Scores
In humans, gene mapping often relies on pedigree analysis and statistical methods.
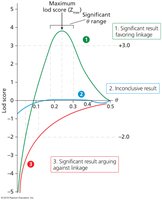
Lod Score: Logarithm of the odds ratio comparing likelihood of linkage vs. independent assortment.
Interpretation: Lod score > 3 indicates evidence for linkage; lod score < -2 indicates evidence against linkage.
Zmax: Most likely recombination distance between marker and disease gene.
Summary Table: Types of Crossovers and Their Use
Type | Frequency | Use |
|---|---|---|
Noncrossover (NCO) | Most frequent | Parental genotype identification |
Single crossover (SCO) | Less frequent | Distance between two genes |
Double crossover (DCO) | Least frequent | Gene order and distance among three genes |
Key Equations
Map Distance:
Coefficient of Coincidence:
Interference:
Lod Score:
Conclusion
Genetic linkage and mapping are essential tools in genetics, allowing researchers to determine gene order, distances, and inheritance patterns. Understanding recombination, interference, and statistical methods like lod scores is crucial for both classical and modern genetic analysis.
