 Back
BackGenetic Linkage and Mapping: Study Guide for College Genetics
Study Guide - Smart Notes
 Tailored notes based on your materials, expanded with key definitions, examples, and context.
Genetic Linkage and Mapping
Introduction to Genetic Linkage
Genetic linkage refers to the phenomenon where genes located close together on the same chromosome tend to be inherited together, rather than assorting independently. This concept is fundamental to understanding how traits are transmitted and how genetic maps are constructed.
Independent Assortment: Genes on different chromosomes or far apart on the same chromosome assort independently during meiosis.
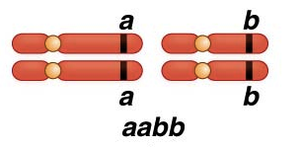
Linkage: Genes close together on the same chromosome do not segregate independently and are said to be linked.
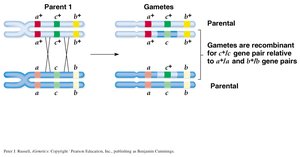
Parental vs. Nonparental Gametes: When genes are linked, parental gametes are more frequent than nonparental (recombinant) gametes.
Mechanism of Linkage: Meiosis and Crossing Over
Linkage is explained by the events of meiosis, particularly during prophase I, when homologous chromosomes pair and crossing-over occurs. The closer two genes are, the less likely a crossover will occur between them.
Complete Linkage: No recombination occurs; genes are inherited together.
Incomplete Linkage: Some recombination occurs due to crossing-over between non-sister chromatids.
Crossing Over: The exchange of genetic material between homologous chromosomes, producing recombinant gametes.
Types of Linkage Relationships
There are three main cases to consider for gene relationships:
Independent Assortment: Genes on different chromosomes or far apart on the same chromosome.
Complete Linkage: Genes are so close that no crossing-over occurs.
Incomplete Linkage: Genes are close but crossing-over can occur, producing recombinants.
Linkage and Genetic Mapping
The frequency of recombination between genes can be used to estimate their distance on a chromosome. This is the basis for genetic mapping.
Map Unit (mu) or CentiMorgan (cM): 1 mu = 1% recombination frequency.
Formula:
Two-Point Testcross: Used to determine the distance between two genes.
Three-Point Testcross and Gene Order
Three-point testcrosses are used to determine the order and distances between three genes. The most frequent gametes are parental, while the least frequent are double crossovers (DCOs).
Single Crossover (SCO): Used to determine the distance between two genes.
Double Crossover (DCO): Used to determine the order and distance among three genes.
Gene Order: The gene whose alleles switch in DCOs is the middle gene.
Calculating Map Distances and Interference
Map distances are calculated by summing the frequencies of single and double crossovers. Interference measures whether crossovers in one region affect the likelihood of crossovers in adjacent regions.
Coefficient of Coincidence (CC):
Interference (I):
Expected DCOs: Product of crossover frequencies in two regions.
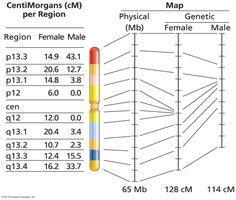
Genetic Maps: Historical and Contemporary
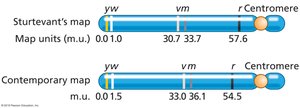
Genetic maps are constructed using recombination frequencies. Early maps, such as Sturtevant's map for Drosophila, have been refined with modern data.
Sturtevant's Map: Early genetic map based on recombination frequencies.
Contemporary Map: Updated with more accurate distances.
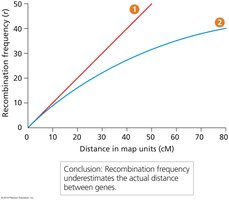
Physical vs. Genetic Distance
Recombination frequency does not always perfectly reflect physical distance, especially for genes far apart. Multiple crossovers can lead to underestimation of actual distance.
Linear vs. Actual Relationship: Recombination frequency underestimates physical distance beyond about 8 cM.
Reason: Multiple crossover events between genes.
Variations in Recombination Rates
Recombination rates can vary by species, sex, and environmental factors. For example, in Drosophila, recombination occurs only in females, and in humans, females have higher recombination rates than males.
Environmental Effects: Temperature, nutrition, etc., can affect recombination rates.
Sex Differences: Human females: 4400 cM; males: 2700 cM.
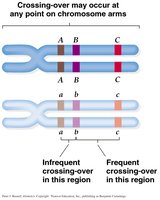
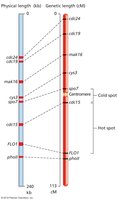
Recombination Hotspots and Coldspots
Recombination probabilities are not equal across a chromosome. Some regions, called hotspots, have higher recombination rates, while coldspots have lower rates.
Hotspots: Regions with high recombination frequency.
Coldspots: Regions with low recombination frequency.
Genetic Markers for Mapping
Genetic markers such as variable number of tandem repeats (VNTRs) and single nucleotide polymorphisms (SNPs) are used for mapping genes, especially in humans and other organisms where controlled crosses are not possible.
VNTRs: Repeated DNA sequences used as markers.
SNPs: Single base pair variations used to track haplotypes.
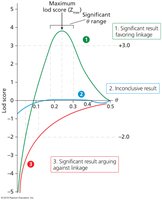
Mapping Genes in Pedigrees: Lod Scores
In human genetics, linkage analysis uses pedigrees and statistical methods to map genes. The lod score (logarithm of odds) compares the likelihood of linkage versus independent assortment.
Lod Score Formula:
Interpretation: Lod score > 3 indicates evidence for linkage; < -2 indicates evidence against linkage.
Zmax: The recombination value (q) with the highest lod score, representing the most likely distance between marker and disease gene.
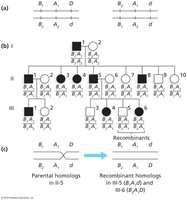
Pedigree Analysis Example
Pedigree analysis is used to track inheritance of disease alleles and their linkage to genetic markers. Recombinant and parental homologs can be identified in family studies.
Application: Used in mapping genes for diseases such as Huntington's disease.
Summary Table: Types of Crossovers and Their Use
Type | Frequency | Use in Mapping |
|---|---|---|
Noncrossover (NCO) | Most frequent | Parental genotype identification |
Single crossover (SCO) | Less frequent | Distance between two genes |
Double crossover (DCO) | Least frequent | Gene order and interference calculation |
Key Equations
Map Distance:
Coefficient of Coincidence:
Interference:
Lod Score:
Conclusion
Genetic linkage and mapping are essential tools in genetics, allowing researchers to determine gene order, estimate distances, and identify genes associated with traits and diseases. Understanding recombination, interference, and the use of genetic markers is crucial for modern genetic analysis.
