 Back
BackGenetic Linkage and Recombination: Principles, Evidence, and Mapping
Study Guide - Smart Notes
 Tailored notes based on your materials, expanded with key definitions, examples, and context.
Genetic Linkage and Recombination
Modifications to Simple Mendelian Inheritance
While Mendel's experiments with pea plants established foundational principles of inheritance, most traits and genes exhibit more complex behaviors. These include sex linkage, incomplete dominance, codominance, multiple alleles, lethal alleles, conditional alleles, penetrance and expressivity, sex modification, gene interaction, and genetic linkage. Mendel's traits were monogenic, showed complete dominance, and had 100% penetrance, but many genes do not assort independently because they are located on the same chromosome.
Mendel’s Dihybrid Cross and the Law of Independent Assortment
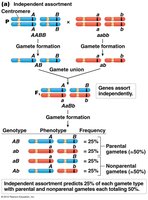
Mendel’s dihybrid crosses demonstrated that traits segregate independently, resulting in a 9:3:3:1 ratio in the F2 generation. This led to the formulation of Mendel’s Second Law:
Law of Independent Assortment: The two copies of a gene for one trait segregate independently from the two copies of a gene for another trait.
Each trait gives a 3:1 ratio of dominant to recessive phenotypes in the F2 generation.
Example: In a cross between smooth yellow (SS YY) and wrinkled green (ss yy) peas, the F2 generation showed four phenotypes in a 9:3:3:1 ratio, confirming independent assortment.

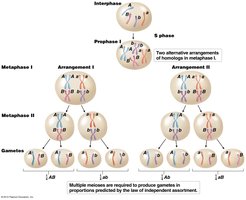
Chromosome Theory and Independent Assortment
The chromosome theory of inheritance established that Mendel’s factors (genes) are located on chromosomes, which segregate randomly during meiosis. This random segregation underlies the law of independent assortment.
Genetic Linkage: Evidence from Dihybrid Crosses
Not all genes assort independently. Genes located on the same chromosome are genetically linked and tend to be inherited together. Early evidence for linkage came from crosses in sweet peas (Bateson and Punnet, 1905) and fruit flies (Morgan, 1911), where observed ratios deviated from Mendelian expectations due to an excess of parental phenotypes.
Linkage and Recombination: Morgan’s Experiments
Morgan’s studies with Drosophila revealed that genes on the same chromosome do not always assort independently. However, he observed recombinant phenotypes, indicating that crossing-over occurs between homologous chromosomes during meiosis, generating new allele combinations.
Genetic linkage: Genes located close together on the same chromosome are inherited together.
Recombination: Physical exchange of chromosome segments during meiosis creates new allele combinations.
Stages of Meiosis and Crossing-Over
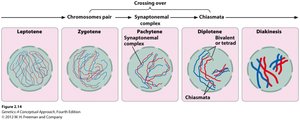
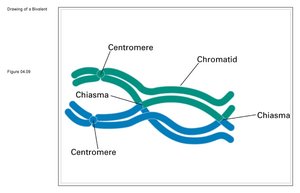
Crossing-over occurs during the pachytene stage of meiosis I prophase, when homologous chromosomes are aligned. The exchange is visible as chiasmata, X-shaped structures where chromatids break and rejoin.
Leptotene: Chromosomes become visible.
Zygotene: Homologous chromosomes pair (synapsis).
Pachytene: Chromosomes thicken; crossing-over occurs.
Diplotene: Homologous chromosomes held together by chiasmata.
Diakinesis: Nuclear envelope breaks down; spindle forms.

Recombination Frequency and Genetic Mapping
The frequency of crossing-over between two genes is proportional to their distance on the chromosome. Recombination frequency is used to construct genetic maps:
Map unit (m.u.) or centiMorgan (cM): 1% recombination = 1 m.u. = 1 cM
Formula:
Example: If 25 recombinants are observed out of 100 progeny, the map distance is 25 m.u. or 25 cM.

Double Crossovers and Map Construction
At longer distances, double crossovers can occur, which may reverse the effect of the first crossover and lead to an underestimate of the genetic distance. Genetic maps are most accurate when constructed using small intervals, minimizing the chance of double crossovers.
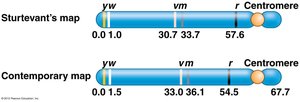
Sturtevant’s First Genetic Map
Alfred Sturtevant, in Morgan’s lab, constructed the first genetic map by analyzing recombination frequencies between pairs of genes on the Drosophila X chromosome. He demonstrated that genes are arranged linearly, each with a defined location.
Gene Pair | # Recombinants/Total | % Recombination |
|---|---|---|
y and w | 214/21,736 | 1.0% |
y and v | 1,464/4,551 | 32.2% |
y and m | 115/324 | 35.5% |
y and r | 260/693 | 37.5% |
w and v | 471/1,584 | 29.7% |
w and m | 2,062/6,116 | 33.7% |
w and r | 406/898 | 45.2% |
v and m | 17/573 | 3.0% |
v and r | 109/405 | 26.9% |
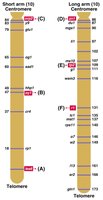
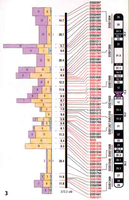
Applications and Limitations of Genetic Maps
Genetic maps were the primary method for locating genes on chromosomes before the advent of molecular genetics and DNA sequencing. They remain important for understanding gene arrangement and inheritance patterns.
Summary Table: Linkage and Recombination
Type | Genes | Recombination Frequency | Gamete Types |
|---|---|---|---|
Independent Assortment | Different chromosomes | 50% | Parental and recombinant (equal) |
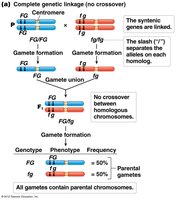
Complete Linkage | Same chromosome, close together | 0% | Parental only |
Partial Linkage | Same chromosome, farther apart | 0-50% | Parental > recombinant |
Additional info: Double crossovers can lead to an underestimate of genetic distance; modern maps use molecular markers and DNA sequencing for greater accuracy.
