 Back
BackGenetic Variation of Populations and the Hardy–Weinberg Principle
Study Guide - Smart Notes
 Tailored notes based on your materials, expanded with key definitions, examples, and context.
Genetic Variation in Populations
Definition of Population and Gene Pool
A population is a group of interbreeding organisms of the same species that live in the same geographic area at the same time. The gene pool refers to the complete set of alleles present in all individuals within a population. Each individual carries a subset of the gene pool, and the genetic makeup of the population is determined by the collective genotypes of its members.
Sources of Genetic Variation
Genetic variation is the diversity of alleles and genotypes within a population. It arises from several sources:
Mutations: Random changes in DNA sequence that introduce new alleles.
Polymorphisms: The presence of two or more alleles at a locus within a population. Most polymorphisms are neutral, meaning they do not affect phenotype or fitness.
Environmental Effects: Environmental factors can influence phenotype, but do not change the underlying genetic variation.
Early scientific assumptions held that populations were genetically homogenous, but research has revealed extensive genetic diversity, much of which is not visible in the phenotype.
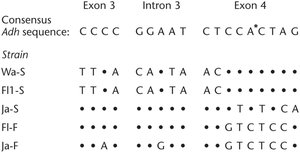
Example: Alcohol Dehydrogenase (Adh) Gene in Drosophila
The Adh gene in Drosophila populations demonstrates genetic variation. Sequencing of the gene from five populations revealed 43 nucleotide differences, but only two alleles (Adh-f and Adh-s) differing by a single amino acid. Most nucleotide changes were in non-coding regions, and only one resulted in an amino acid substitution.
Phenotypic Similarity and Genetic Diversity
Populations may appear phenotypically identical but can differ genetically at multiple loci. This highlights that not all genetic variation is reflected in observable traits.
Polymorphisms: Creation and Maintenance
Genetic polymorphism occurs when multiple alleles exist for a gene within a population. Polymorphisms are generated by mutation and can be lost through selection (if they affect fitness) or genetic drift (if neutral). Most polymorphisms are neutral and do not confer a selective advantage or disadvantage.
Allele and Genotype Frequencies
Calculating Allele Frequencies
Allele frequency is the proportion of a specific allele among all alleles for a gene in a population. For a gene with two alleles (A and a):
Frequency of A ():
Frequency of a ():
By definition,
For example, in a population with 5 AA, 4 Aa, and 1 aa individuals (total 10 individuals, 20 alleles):
A alleles:
a alleles:
Frequency of A:
Frequency of a:
Calculating Genotype Frequencies
Genotype frequency is the proportion of each genotype in the population. For two alleles (A and a):
Frequency of AA:
Frequency of Aa:
Frequency of aa:
Probability-Based Reasoning and Punnett Squares
Assuming random mating, the probability of each genotype in the next generation can be calculated using allele frequencies:
Probability of AA:
Probability of aa:
Probability of Aa:
These probabilities can be visualized using a Punnett square, where the frequencies of gametes determine the expected genotype frequencies in offspring.
The Hardy–Weinberg Principle
Statement and Equation
The Hardy–Weinberg equilibrium describes a population in which allele and genotype frequencies remain constant from generation to generation, provided that certain assumptions are met (no selection, mutation, migration, infinite population size, and random mating). The principle is expressed as:
(genotype frequencies)
(allele frequencies)
Where:
= frequency of AA
= frequency of Aa
= frequency of aa
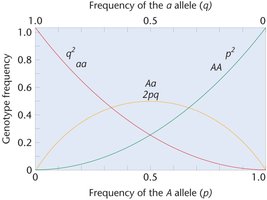
Visualizing Hardy–Weinberg Equilibrium
The relationship between allele and genotype frequencies can be visualized graphically. Heterozygote frequency (2pq) is maximized when both alleles are at equal frequency (p = q = 0.5). As one allele becomes more common, homozygote frequencies increase and heterozygote frequency decreases.
Assumptions of the Hardy–Weinberg Model
The Hardy–Weinberg model assumes:
No selection (equal survival and reproduction rates)
No mutation (no new alleles)
No migration (no gene flow)
Infinitely large population (no genetic drift)
Random mating
In reality, these conditions are rarely met, so Hardy–Weinberg equilibrium serves as a null hypothesis to detect evolutionary change.
Applications and Interpretation
Testing for Evolution
By comparing observed genotype frequencies to those expected under Hardy–Weinberg equilibrium, researchers can determine if a population is evolving at a specific locus. Deviations from expected frequencies suggest that one or more evolutionary forces (selection, drift, mutation, migration, non-random mating) are acting on the population.
Worked Example: Calculating Heterozygote Frequency
In a population of 50 mice, coat color is determined by a single gene with two alleles: agouti (A, dominant) and white (a, recessive). If the frequency of the agouti allele is 0.4 and the white allele is 0.6, the expected frequency of heterozygotes (Aa) is:
Number of heterozygotes:
Summary Table: Allele and Genotype Frequency Calculations
Genotype | Number | Allele Count |
|---|---|---|
AA | 5 | 10 A |
Aa | 4 | 4 A, 4 a |
aa | 1 | 2 a |
Total | 10 | 14 A, 6 a |
Allele frequencies: A = 0.7, a = 0.3
Key Terms
Population: Group of interbreeding organisms in the same location and time.
Gene pool: All alleles present in a population.
Allele frequency: Proportion of a specific allele in the gene pool.
Genotype frequency: Proportion of a specific genotype in the population.
Polymorphism: Presence of two or more alleles at a locus.
Hardy–Weinberg equilibrium: State where allele and genotype frequencies remain constant in the absence of evolutionary forces.
