 Back
Genetics Exam 1 Review: Chromosomes, Pedigrees, Probabilities, and Bacterial Genetics
Study Guide - Smart Notes
 Tailored notes based on your materials, expanded with key definitions, examples, and context.
Chromosomes and Chromatids
Chromosome and Chromatid Counting
Understanding chromosome and chromatid numbers is fundamental in genetics, especially when analyzing cell division processes such as mitosis and meiosis.
Haploid (1n): A cell with one set of chromosomes. Example: If 1n = 12, then the diploid number (2n) is 24.
Diploid (2n): A cell with two sets of chromosomes.
Chromosome Number: Determined by counting centromeres.
Chromatid Number: Determined by counting the arms of chromosomes (each chromosome in X form has two chromatids).
Chromatids in Mitosis
During metaphase of mitosis in a diploid cell (1n = 6):
Diploid means 2n = 12 chromosomes.
In metaphase, chromosomes are in X form, so there are 24 chromatids.
Chromatids in Meiosis
Meiosis involves two divisions, resulting in haploid cells.
Start: Diploid cell (2n = 12 chromosomes, 24 chromatids).
After Meiosis I: Chromosome number halves (1n = 6 chromosomes, 12 chromatids).
After Meiosis II: Each cell has 6 chromosomes and 6 chromatids.
Pedigree Analysis
Identifying Inheritance Patterns
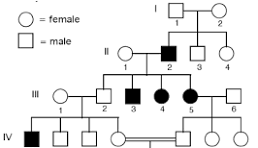
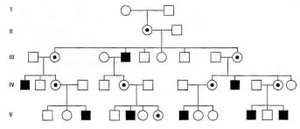
Pedigrees are diagrams that show the inheritance of traits across generations. They are used to determine whether traits are autosomal or sex-linked, and dominant or recessive.
Autosomal Recessive: Affected children can have unaffected parents.
X-linked Recessive: More males are affected; trait is often passed through females.
Incomplete Penetrance: Not all individuals with the genotype express the phenotype.
Example: Pedigree Analysis
Look for affected children with unaffected parents to identify recessive inheritance. X-linked recessive traits often show more affected males and are transmitted through carrier females.
Punnett Squares and Probability
X-linked Punnett Squares
Punnett squares are used to predict the outcome of genetic crosses. X-linked crosses require careful attention to sex chromosomes.
RR x rr: All offspring are Rr.
XRXR x XrY: All offspring show dominant phenotype.
Test Cross: Female test cross yields half males with recessive phenotype; male test cross yields all males recessive, all females dominant.
XrXr x XRY: All males are recessive, all females dominant.
Dihybrid Punnett Squares
Dihybrid crosses involve two genes and can be analyzed using Punnett squares.
Dihybrid TtPp x TtPp: Ratio is 9:3:3:1.
Dihybrid test cross TtPp x ttpp: Ratio is 1:1:1:1.
Monohybrid Tt x Tt: Ratio is 3:1.
Monohybrid Tt x tt: Ratio is 1:1.
Probability Calculations
Probability in genetics can be calculated using sum, product, and binomial rules.
SUM Rule: For mutually exclusive events.
PRODUCT Rule: For sequential events (e.g., first tall, then short).
BINOMIAL Rule: For unordered events (e.g., 4 out of 7).
Binomial Example: Cat Coat Patterns
Cross: Tt x Tt (mackerel tabby dominant, classic tabby recessive)
Expected: 75% mackerel, 25% classic.
Probability of 5 out of 8 classic tabby kittens:
Use the binomial formula:
n = 8, x = 5, p = 0.25 (classic), q = 0.75 (mackerel)
Chi Square Analysis
Chi Square Test
The chi square test is used to compare observed and expected results in genetic crosses.
Expected: Theoretical ratio from Punnett square.
Observed: Actual data from experiment.
Chi square formula:
O = observed value
E = expected value
Chromosome Mapping
Test Cross and Recombination Frequency
Chromosome mapping in eukaryotes uses test crosses to determine recombination frequency.
Test Cross: Ratio is 1:1:1:1.
Parentals: Offspring with parental genotype.
Nonparentals: Offspring with recombinant genotype.
Recombination Frequency:
Map Units (cM): 1% recombination = 1 cM.
Alternative equation:
Extensions of Mendelian Genetics
Lethal Alleles and Epistasis
Extensions include lethal alleles and gene interactions such as epistasis.
Lethal Alleles: Can result in a 2:1 ratio in offspring.
Epistasis: Interaction between two genes affects phenotype.
Complementation Groups
Gene Complementation
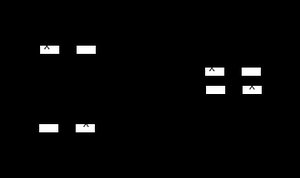
Complementation tests determine whether mutations are in the same gene or different genes.
Same gene: Mutations do not complement.
Different gene: Mutations complement.
Bacterial Genetics
Bacterial Conjugation
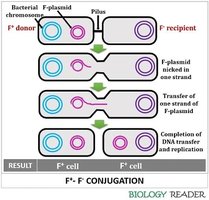
Bacterial conjugation is a process of genetic exchange involving F factors.
F+: Donor cell with fertility plasmid.
F-: Recipient cell without plasmid.
Hfr: High frequency recombination cell.
F': Cell with F plasmid carrying additional genes.
Merozygote: Partial diploid cell formed during conjugation.
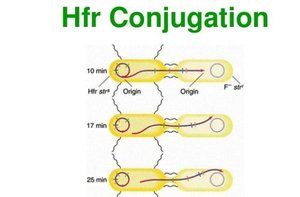
Hfr Conjugation
Hfr cells transfer chromosomal genes to F- cells during conjugation, allowing mapping of bacterial genes.
Viral Life Cycles
Bacteriophage Genetics
Bacteriophages are viruses that infect bacteria and are used in genetic mapping and analysis.
Lytic Cycle: Virus replicates and lyses host cell.
Lysogenic Cycle: Viral DNA integrates into host genome.
Additional info: Viral life cycles are important for understanding genetic exchange and mapping in bacteria.
----------------------------------------
