 Back
BackGenetics Final Exam Review – Step-by-Step Study Guidance
Study Guide - Smart Notes
 Tailored notes based on your materials, expanded with key definitions, examples, and context.
Q1. In the LOD analysis chart, answer the following:
Which PL marker is most tightly linked to the disease-causing gene?
Which combination of markers is closer: PL1 and PL2, or PL3 and PL4?
What is the most likely recombination distance between the PL3 and PL4 markers?
Background
Topic: Linkage Analysis and LOD Scores
This question tests your understanding of how to interpret LOD (logarithm of odds) score graphs to determine genetic linkage and recombination frequencies between genes and markers. LOD scores are used to estimate the likelihood that two loci are linked and to estimate the recombination fraction between them.
Key Terms and Concepts:
LOD Score: A statistical estimate of whether two loci are likely to be located near each other on a chromosome and therefore inherited together.
Recombination Fraction (%): The percentage of recombination events between two loci; lower values indicate closer linkage.
Genetic Marker: A known DNA sequence used to track inheritance patterns.
Tight Linkage: Markers or genes that are very close together on a chromosome (low recombination %).
Key Formula:
The LOD score is calculated as:
Step-by-Step Guidance
Examine the LOD score curves for each marker pair on the graph. The peak of each curve indicates the most likely recombination fraction between the two loci.
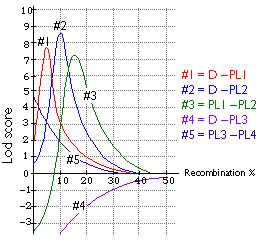
Identify which marker pair has the highest LOD score at the lowest recombination percentage. This pair is most tightly linked to the disease gene (D).
Compare the LOD score peaks for PL1–PL2 and PL3–PL4. The pair with the peak at a lower recombination percentage is closer together on the chromosome.
For PL3–PL4, find the recombination percentage at which the LOD score curve (#5) reaches its maximum. This value represents the most likely recombination distance between these two markers.
Try solving on your own before revealing the answer!
