 Back
Genetics Study Guide: Mitosis, Meiosis, and Mendelian Genetics
Study Guide - Smart Notes
 Tailored notes based on your materials, expanded with key definitions, examples, and context.
Session Roadmap: Genetics Topics
Overview
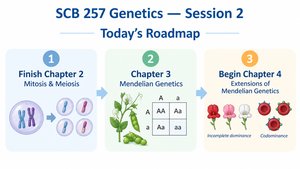
This session covers foundational concepts in genetics, focusing on mitosis and meiosis, Mendelian genetics, and extensions of Mendelian principles. These topics are essential for understanding inheritance, cell division, and genetic variation.
Section 2.3: The Cell Cycle
Cell Cycle Fundamentals
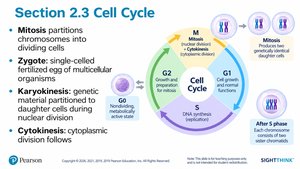
The cell cycle is the series of events that cells undergo as they grow and divide. It consists of interphase (G1, S, G2) and mitosis (M phase), followed by cytokinesis.
Mitosis: Partitions chromosomes into dividing cells.
Zygote: Single-celled fertilized egg of multicellular organisms.
Karyokinesis: Division of genetic material during nuclear division.
Cytokinesis: Division of cytoplasm following karyokinesis.
Interphase and Cell Cycle
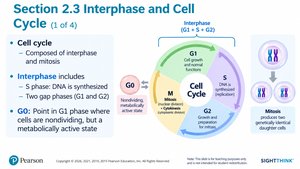
Interphase is the period between cell divisions, where the cell grows and DNA is replicated. The cell cycle is composed of interphase and mitosis.
S phase: DNA is synthesized.
G1 and G2 phases: Growth and preparation for mitosis.
G0 phase: Cells are metabolically active but not dividing.
Cell Cycle Regulation and Checkpoints
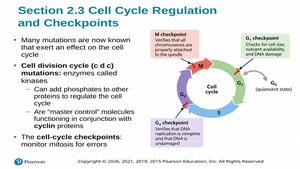
Cell cycle checkpoints ensure proper division and prevent errors. Mutations in cell division cycle genes (cdk) can affect regulation.
Checkpoints: Monitor mitosis for errors.
Cell division cycle mutations: Affect proteins that regulate the cell cycle.
Mitosis: Stages
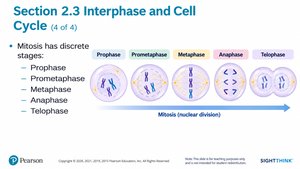
Mitosis is divided into discrete stages: prophase, prometaphase, metaphase, anaphase, and telophase. Each stage is characterized by specific events in chromosome behavior and cell structure.
Prophase: Chromosomes condense.
Prometaphase: Nuclear envelope breaks down.
Metaphase: Chromosomes align at the metaphase plate.
Anaphase: Sister chromatids separate.
Telophase: Chromosomes decondense and nuclear envelope reforms.
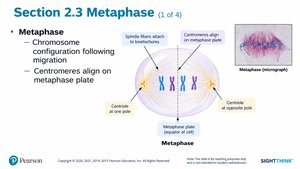
Metaphase
During metaphase, chromosomes align at the metaphase plate, and spindle fibers attach to centromeres.
Centromeres: Align at metaphase plate.
Spindle fibers: Attach to kinetochores.
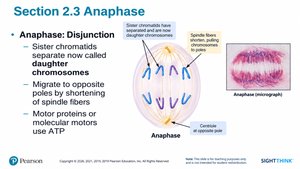
Anaphase
In anaphase, sister chromatids separate and migrate to opposite poles, becoming daughter chromosomes. Motor proteins use ATP to facilitate movement.
Disjunction: Separation of sister chromatids.
Spindle fibers: Shorten to move chromosomes.
Section 2.4: Meiosis
Meiosis—Reduction of Genetic Content
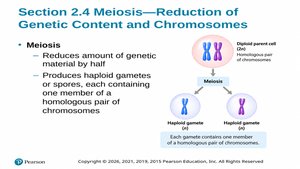
Meiosis reduces the amount of genetic material by half, producing haploid gametes or spores. Each gamete contains one member of a homologous chromosome pair.
Diploid parent cell: Contains homologous pairs.
Haploid gametes: Each contains one chromosome from each pair.
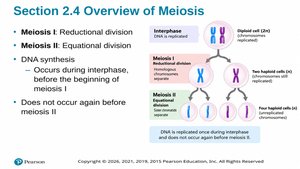
Overview of Meiosis
Meiosis consists of two divisions: Meiosis I (reductional) and Meiosis II (equational). DNA synthesis occurs during interphase before meiosis I, but not again before meiosis II.
Meiosis I: Homologous chromosomes separate.
Meiosis II: Sister chromatids separate.
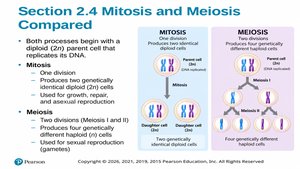
Mitosis vs. Meiosis
Mitosis and meiosis both begin with a diploid parent cell, but differ in their outcomes and purposes.
Mitosis: Produces two genetically identical diploid cells for growth and repair.
Meiosis: Produces four genetically different haploid cells for sexual reproduction.
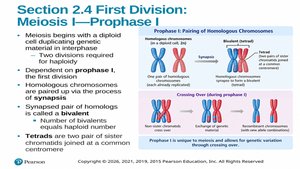
Meiosis I: Prophase I
Prophase I involves pairing of homologous chromosomes (synapsis) and crossing over, which increases genetic variation.
Bivalent: Synapsed pair of homologs.
Tetrad: Two pairs of sister chromatids joined at a common centromere.
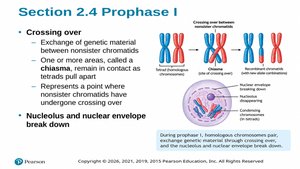
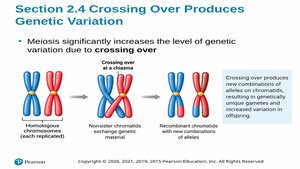
Crossing Over
Crossing over is the exchange of genetic material between nonsister chromatids at chiasmata, resulting in recombinant chromosomes.
Chiasma: Point of crossing over.
Genetic variation: Increased by crossing over.
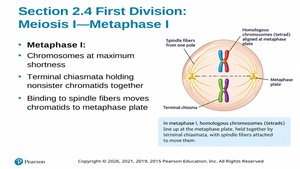
Metaphase I
Chromosomes reach maximum shortness and align at the metaphase plate. Terminal chiasmata hold nonsister chromatids together.
Spindle fibers: Move chromatids to metaphase plate.
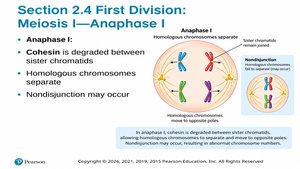
Anaphase I
Cohesin is degraded between sister chromatids, homologous chromosomes separate, and nondisjunction may occur.
Nondisjunction: Failure of homologs to separate, leading to abnormal chromosome numbers.
Crossing Over Produces Genetic Variation
Meiosis increases genetic variation through crossing over, producing new combinations of alleles.
Recombinant chromatids: Chromatids with new allele combinations.
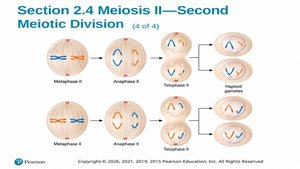
Meiosis II—Second Meiotic Division
Meiosis II separates sister chromatids, resulting in four haploid cells. Each cell contains one member of each homologous chromosome pair.
Anaphase II: Sister chromatids separated.
Telophase II: Chromosomes present at each pole.
Cytokinesis: Results in four haploid cells.
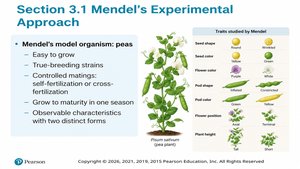
Section 3.1: Mendel's Experimental Approach
Mendel's Model Organism: Peas
Mendel used peas for genetic experiments due to their ease of growth, true-breeding strains, controlled mating, and observable characteristics with two distinct forms.
Traits studied: Seed shape, color, pod shape, flower color, etc.
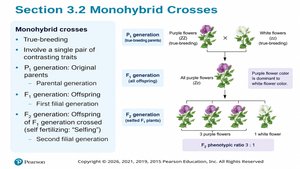
Section 3.2: Monohybrid Crosses
Monohybrid Crosses
Monohybrid crosses involve a single pair of contrasting traits and are used to study inheritance patterns.
P generation: Original parents.
F1 generation: First filial offspring.
F2 generation: Offspring of F1 generation.
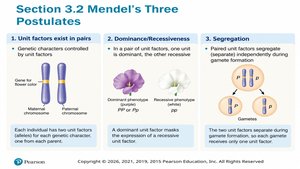
Mendel's Three Postulates
Mendel proposed three postulates to explain inheritance:
Unit factors exist in pairs: Genetic characters controlled by unit factors.
Dominance/Recessiveness: One unit is dominant, the other recessive.
Segregation: Paired unit factors segregate independently during gamete formation.
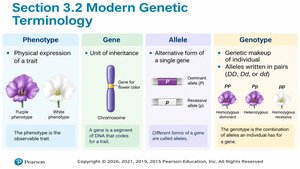
Modern Genetic Terminology
Key terms in genetics include phenotype, gene, allele, and genotype.
Phenotype: Physical expression of a trait.
Gene: Unit of inheritance.
Allele: Alternative form of a gene.
Genotype: Genetic makeup of an individual.
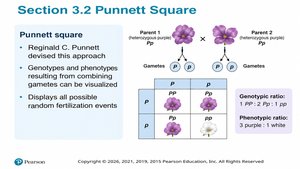
Punnett Square
The Punnett square is a tool to visualize genotypes and phenotypes resulting from combining gametes.
Displays: All possible random fertilization events.
Genotypic ratio: 1 PP : 2 Pp : 1 pp.
Phenotypic ratio: 3 purple : 1 white.
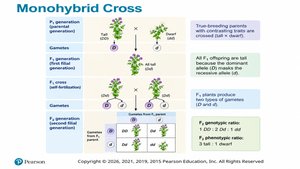
Monohybrid Cross Example
True-breeding parents with contrasting traits produce offspring with dominant traits masking recessive traits. F2 generation shows a 3:1 phenotypic ratio.
Genotypic ratio: 1 DD : 2 Dd : 1 dd.
Phenotypic ratio: 3 dominant : 1 recessive.
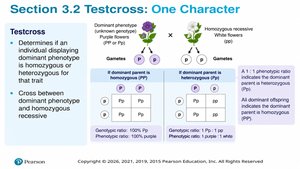
Testcross: One Character
A testcross determines if an individual displaying a dominant phenotype is homozygous or heterozygous for that trait.
Cross: Dominant phenotype with homozygous recessive.
Genotypic ratio: 1:1 or 100% dominant, depending on genotype.
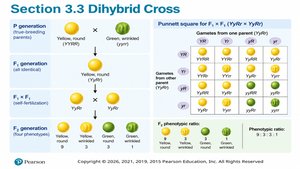
Section 3.3: Dihybrid Crosses and Independent Assortment
Dihybrid Cross
Dihybrid crosses involve two pairs of contrasting traits and demonstrate independent assortment.
P generation: True-breeding parents.
F1 generation: Offspring heterozygous for both traits.
F2 generation: Four phenotypes in a 9:3:3:1 ratio.
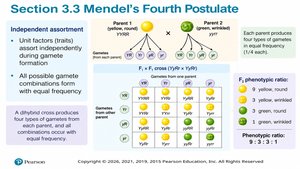
Mendel's Fourth Postulate: Independent Assortment
Unit factors assort independently during gamete formation, producing all possible gamete combinations with equal frequency.
Phenotypic ratio: 9:3:3:1.
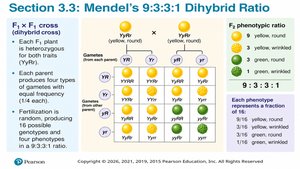
Mendel's 9:3:3:1 Dihybrid Ratio
The F1 x F1 cross produces four types of gametes, resulting in a 9:3:3:1 phenotypic ratio in the F2 generation.
Each phenotype: Represents a fraction of the total offspring.
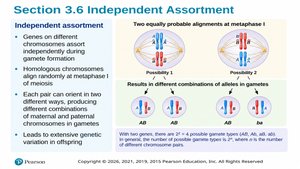
Independent Assortment
Genes on different chromosomes assort independently during gamete formation, leading to extensive genetic variation in offspring.
Homologous chromosomes: Align randomly at metaphase I.
Number of possible gamete types: where n = number of chromosome pairs.
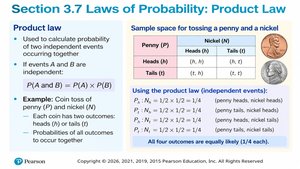
Section 3.7: Laws of Probability
Product Law
The product law calculates the probability of two independent events occurring together.
Formula:
Example: Coin toss of penny (P) and nickel (N).
Sum Law
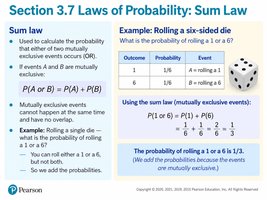
The sum law calculates the probability that either of two mutually exclusive events occurs.
Formula:
Example: Rolling a six-sided die.
Section 3.8: Chi-Square Analysis
Chi-Square Analysis
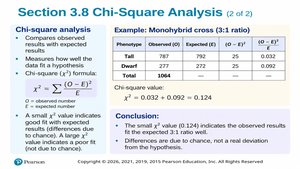
Chi-square analysis compares observed results with expected results to test hypotheses.
Formula:
Small value: Indicates good fit with expected results.
Large value: Indicates poor fit.
Chi-Square and Null Hypothesis
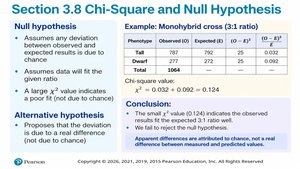
The null hypothesis assumes any deviation between observed and expected results is due to chance. The alternative hypothesis proposes that the deviation is due to a real difference.
Small value: Accept null hypothesis.
Large value: Reject null hypothesis.
Chi-Square Table (Critical Values)
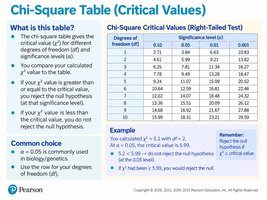
The chi-square table gives the critical value for different degrees of freedom and significance levels. Compare your calculated value to the table to determine whether to reject the null hypothesis.
Common choice: significance level.
Degrees of freedom: Number of categories minus one.
Section 3.9: Pedigree Analysis
Pedigree Analysis
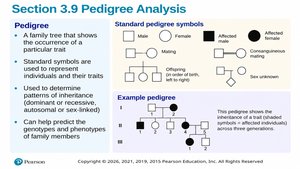
A pedigree is a family tree that shows the occurrence of a particular trait. Standard symbols are used to represent individuals and their traits, helping to determine patterns of inheritance.
Patterns: Dominant, recessive, autosomal, or sex-linked.
Predict genotypes: Can help predict genotypes and phenotypes of family members.
Pedigree Conventions
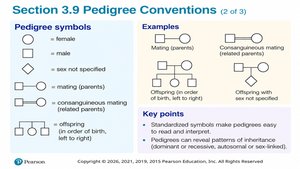
Standardized symbols make pedigrees easy to read and interpret. Pedigrees can reveal patterns of inheritance and help in genetic counseling.
Symbols: Female (circle), male (square), mating (horizontal line), offspring (vertical line).
