 Back
BackGenomic Mapping and Polymorphism Analysis in Human Genetics
Study Guide - Smart Notes
 Tailored notes based on your materials, expanded with key definitions, examples, and context.
Genetic and Physical Maps of Genomes
Overview of Genetic and Physical Maps
Genetic and physical maps are essential tools in genomics for understanding the structure and function of chromosomes. Genetic maps are constructed based on recombination frequencies between markers, while physical maps are based on the actual DNA sequence and distances measured in base pairs (bp).
Genetic Maps: Indicate the relative positions of genes or markers based on recombination frequencies (measured in centiMorgans, cM).
Physical Maps: Show the actual physical distances between markers, often using restriction enzyme sites or DNA sequencing data.
Limitations: Genetic maps can underestimate distances due to multiple crossovers and non-uniform recombination rates.
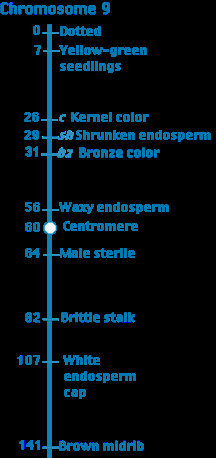
Example: The genetic map of chromosome 9 in Zea mays (corn) shows the positions of various genes and the centromere, illustrating how genetic maps are organized.
Comparison of Genetic and Physical Maps
Genetic (Linkage) Maps: Based on recombination frequencies; loci correspond to phenotypic traits.
Physical Maps: Based on DNA sequence; provide direct order and spacing of genes.
As a rough estimate, 1 cM ≈ 1 Mb (1 million base pairs), but this varies by region and organism.
Genomic Variation and Polymorphisms
Types of Polymorphisms
Polymorphisms are variations in DNA sequence among individuals. They can be harmless, harmful, or latent, and may or may not affect gene function.
SNP (Single Nucleotide Polymorphism): A single base pair change present in at least 1% of the population.
VNTR (Variable Number of Tandem Repeats): Short sequences repeated in tandem; used in DNA fingerprinting.
RFLP (Restriction Fragment Length Polymorphism): Variation in restriction enzyme recognition sites due to sequence changes.
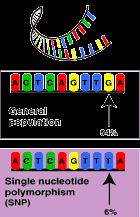
Example: SNPs are the most common type of genetic variation and are responsible for most differences between individuals.
Haplotypes and SNPs
A haplotype is a set of SNPs found on the same chromosome that are inherited together. Haplotypes are useful for studying genetic linkage and disease association.
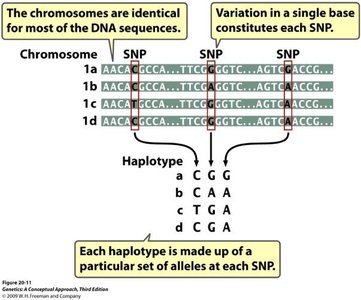
Example: Each haplotype is defined by a unique combination of SNP alleles at specific positions.
Polymorphisms in Human Genes: TAS2R38 Example
The TAS2R38 gene encodes a bitter taste receptor. Polymorphisms in this gene determine whether an individual can taste certain bitter compounds (e.g., PTC).
Position | Taster | Non-Taster |
|---|---|---|
145 | Pro | Ala |
785 | Ala | Val |
886 | Val | Ile |
Table 1: Polymorphisms and Amino Acid changes in TAS2R38
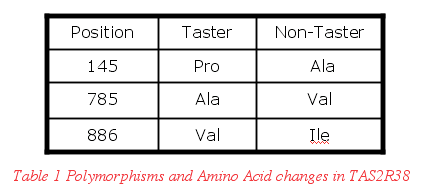
Example: The PAV haplotype is associated with tasters, while the AVI haplotype is associated with non-tasters.
Restriction Fragment Length Polymorphism (RFLP) Analysis
Principle of RFLP
RFLP analysis detects variations in DNA sequences by using restriction enzymes that cut DNA at specific recognition sites. Sequence changes can create or abolish these sites, resulting in different fragment patterns after digestion and gel electrophoresis.
Restriction Enzymes: Proteins that recognize specific palindromic DNA sequences and cleave both strands.
RFLP: Sequence changes that alter restriction sites, leading to different fragment sizes among individuals.
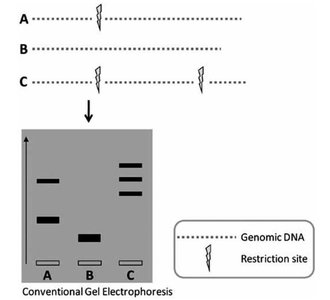
Example: Individuals with different numbers or positions of restriction sites show distinct banding patterns on a gel.
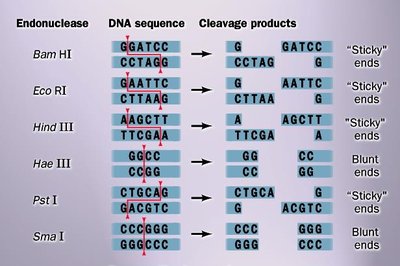
Common Restriction Enzymes
Endonuclease | DNA Sequence | Cleavage Products | Ends |
|---|---|---|---|
BamHI | GGATCC | G/GATCC | Sticky |
EcoRI | GAATTC | G/AATTC | Sticky |
HindIII | AAGCTT | A/AGCTT | Sticky |
HaeIII | GGCC | GG/CC | Blunt |
PstI | CTGCAG | CTGCA/G | Sticky |
SmaI | CCCGGG | CCC/GGG | Blunt |
Gel Electrophoresis for DNA Fragment Separation
Gel electrophoresis separates DNA fragments by size. DNA is loaded into wells in an agarose gel, and an electric field causes fragments to migrate toward the positive electrode. Smaller fragments move faster and farther than larger ones.
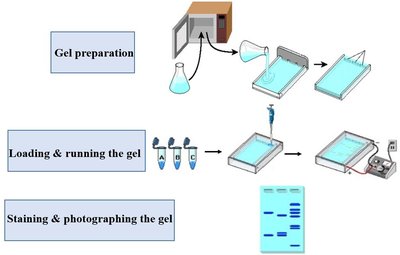
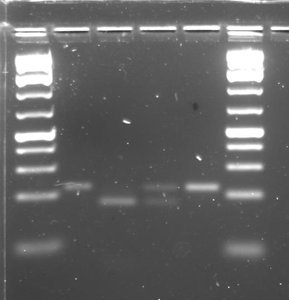
Example: DNA ladders are used as size markers to estimate the length of unknown fragments.
RFLP Analysis for Genotyping and Disease Association
RFLP analysis can distinguish between normal and mutant alleles based on the presence or absence of restriction sites. This is useful for genotyping and identifying disease-associated mutations.
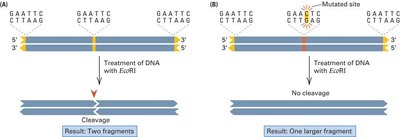
Example: A SNP that removes a restriction site will result in a larger fragment after digestion, while the normal allele will be cut into smaller fragments.
Technical Methods: PCR and Southern Blotting
Polymerase Chain Reaction (PCR)
PCR is a technique used to amplify a specific DNA region exponentially. It requires template DNA, sequence-specific primers, nucleotides, and a thermostable DNA polymerase (e.g., Taq polymerase).
Steps: Denaturation (95°C), Annealing (55–65°C), Extension (72°C).
After n cycles, the number of DNA molecules is .

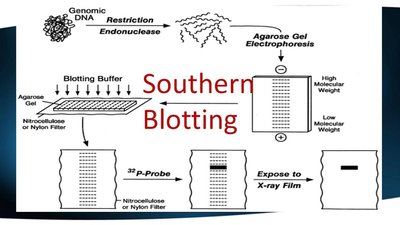
Southern Blotting
Southern blotting is used to detect specific DNA fragments. DNA is digested, separated by gel electrophoresis, transferred to a membrane, and hybridized with a labeled probe complementary to the sequence of interest.

Example: Southern blotting can identify RFLPs associated with disease alleles in pedigrees.
Applications: RFLP Analysis in Human Genetics
Genetic Linkage and Disease Association
RFLP markers can be used to study genetic linkage in families. If a polymorphism is close to a disease gene, it will co-segregate with the disease phenotype due to low recombination frequency.
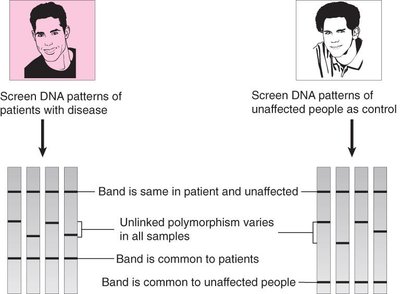
Example: In a pedigree, the presence of a specific RFLP pattern can indicate the inheritance of a disease allele.
Case Study: Sickle Cell Anemia
Sickle cell anemia is caused by a point mutation in the β-globin gene, which can be detected by RFLP analysis. The mutation alters a restriction site, resulting in different fragment patterns for normal, carrier, and affected individuals.
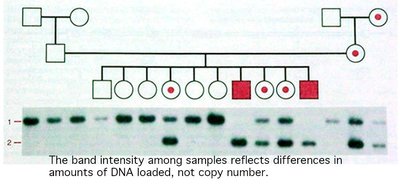
Example: Southern blotting reveals distinct banding patterns for BB (normal), Bb (carrier), and bb (affected) genotypes.
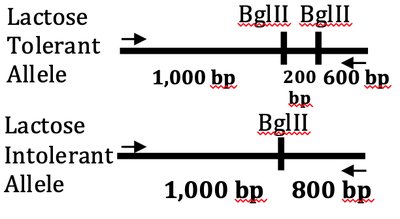
Case Study: Lactose Intolerance
RFLP analysis can also be used to study the genetic basis of lactose intolerance. Different alleles produce distinct fragment patterns after digestion with a restriction enzyme (e.g., BglII).
Summary Table: Key Concepts in Genomic Mapping and Polymorphism Analysis
Concept | Description | Application |
|---|---|---|
Genetic Map | Based on recombination frequencies | Gene mapping, linkage analysis |
Physical Map | Based on DNA sequence or restriction sites | Genome sequencing, fine mapping |
SNP | Single base change | Genetic diversity, disease association |
RFLP | Variation in restriction sites | Genotyping, mutation detection |
PCR | Amplifies DNA regions | Diagnostics, forensics, research |
Southern Blot | Detects specific DNA fragments | Gene identification, RFLP analysis |
Additional info: The notes above integrate foundational concepts from chapters on chromosome mapping, polymorphism analysis, and molecular techniques, providing a comprehensive overview suitable for genetics students preparing for exams.
