 Back
BackHeritability: Broad Sense and Narrow Sense in Quantitative Genetics
Study Guide - Smart Notes
 Tailored notes based on your materials, expanded with key definitions, examples, and context.
Heritability in Quantitative Genetics
Introduction to Heritability
Heritability is a key concept in quantitative genetics, describing the proportion of observed variation in a trait that can be attributed to genetic factors. It is essential for understanding how traits are inherited and how populations respond to selection, especially in breeding and evolutionary biology.
Partitioning Phenotypic Variance
Components of Phenotypic Variance
Total phenotypic variance (VT) in a population can be partitioned into genetic and environmental components. This partitioning helps to distinguish the sources of variation in quantitative traits.
Genetic variance (VG): Variation due to genetic differences among individuals.
Environmental variance (VE): Variation due to differences in environmental conditions experienced by individuals (e.g., light, temperature, nutrition).
The total variance can be expressed as:
Genetic variance can be further subdivided into:
Additive genetic variance (VA): The sum of the average effects of individual alleles. This is the main component transmitted from parents to offspring.
Dominance variance (VD): Variation due to interactions between alleles at the same locus (dominance effects).
Epistatic variance (VI): Variation due to interactions between alleles at different loci (epistasis).
Thus, the full partition is:
or
where
Examples of Genetic Variance Components
Additive variance: Each additional allele adds a consistent, predictable effect to the phenotype (e.g., plant height increases by a fixed amount per allele).
Dominance variance: The effect of an allele depends on the other allele present (e.g., heterozygote has the same phenotype as one homozygote, masking the other allele’s effect).
Epistatic variance: Alleles at one gene can mask or alter the expression of alleles at another gene (e.g., recessive homozygous a masks the effect of B and b alleles).
Broad-Sense and Narrow-Sense Heritability
Definitions and Interpretation
Heritability quantifies the proportion of phenotypic variance attributable to genetic factors. There are two main types:
Broad-sense heritability (H2): Measures the proportion of total phenotypic variance due to all genetic variance (additive, dominance, and epistatic).
Narrow-sense heritability (h2): Measures the proportion of total phenotypic variance due only to additive genetic variance.
Formulas:
Interpretation:
High h2 means a trait is strongly influenced by additive genetic factors and will respond well to selection.
Low h2 means environmental factors or non-additive genetic effects are more important.

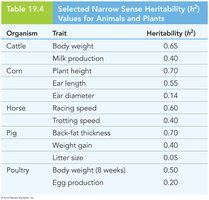
Examples of Narrow-Sense Heritability in Agriculture
Narrow-sense heritability is especially important in plant and animal breeding, as it predicts the response to selection.
Organism | Trait | Heritability (h2) |
|---|---|---|
Cattle | Body weight | 0.65 |
Cattle | Milk production | 0.40 |
Corn | Plant height | 0.70 |
Corn | Ear length | 0.55 |
Corn | Ear diameter | 0.14 |
Horse | Racing speed | 0.60 |
Horse | Trotting speed | 0.40 |
Pig | Back-fat thickness | 0.70 |
Pig | Weight gain | 0.40 |
Pig | Litter size | 0.05 |
Poultry | Body weight (8 weeks) | 0.50 |
Poultry | Egg production | 0.20 |
Calculating Heritability
Estimating Broad-Sense Heritability
Broad-sense heritability is calculated as:
Where:
VG = Genetic variance
VT = Total phenotypic variance
Estimating Narrow-Sense Heritability
Narrow-sense heritability is calculated as:
Where:
VA = Additive genetic variance
VT = Total phenotypic variance
Predicting Offspring Phenotypes Using Narrow-Sense Heritability
Parent–Offspring Regression Equation
Narrow-sense heritability can be used to predict the mean phenotype of offspring based on parental values. The equation is:
TO: Predicted mean trait value of offspring
μ: Population mean trait value
TM: Trait value of male parent
TF: Trait value of female parent
h2: Narrow-sense heritability
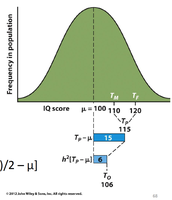
Worked Example
Population mean (μ): 100
Male parent (TM): 110
Female parent (TF): 120
Narrow-sense heritability (h2): 0.4
Step 1: Calculate midparent value: (110 + 120)/2 = 115
Step 2: Deviation from mean: 115 - 100 = 15
Step 3: Multiply by h2: 0.4 × 15 = 6
Step 4: Add to mean: 100 + 6 = 106 (predicted offspring mean)
Heritability and Response to Selection
The Breeder’s Equation
The breeder’s equation relates heritability to the response to selection in a population:
R: Response to selection (difference between offspring mean and original population mean)
S: Selection differential (difference between selected parents’ mean and original population mean)
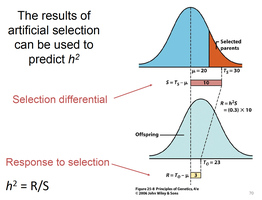
Worked Example
Mean of selected parents (Ts): 40
Population mean (μ): 30
Offspring mean (TO): 33
Selection differential: S = 40 - 30 = 10
Response to selection: R = 33 - 30 = 3
Heritability:
Interpreting Heritability Values
Understanding the Extremes
If h2 = 1: All variation is genetic; offspring mean equals selected parents’ mean.
If h2 = 0: All variation is environmental; selection has no effect on offspring mean.
Intermediate values: Both genetics and environment contribute; response to selection is proportional to h2.
Heritability and Population Genetics
Genetic Basis of Response to Selection
When a population responds to selection (R > 0), the frequency of beneficial alleles increases in the population. This connects quantitative genetics to population genetics, as selection alters allele frequencies over generations.
Summary Table: Key Equations in Heritability
Equation | Description |
|---|---|
Broad-sense heritability | |
Narrow-sense heritability | |
Predicting offspring mean | |
Breeder’s equation (response to selection) |
