 Back
BackLinkage and Chromosome Mapping in Eukaryotes
Study Guide - Smart Notes
 Tailored notes based on your materials, expanded with key definitions, examples, and context.
Linkage and Mapping of Eukaryotic Chromosomes
Introduction to Linkage
Genes located on the same chromosome tend to be inherited together, a phenomenon known as linkage. Unlike genes on different chromosomes, linked genes do not assort independently during meiosis. The study of linkage and recombination is fundamental for understanding genetic inheritance and constructing genetic maps.
Independent Assortment: Genes on different chromosomes assort independently.
Linkage: Genes on the same chromosome may segregate together, especially if they are close to each other.
Linked Alleles: Often inherited together, resulting in parental phenotypes being more common than recombinant phenotypes.
Historical Discovery of Linked Genes
The first report of linkage was observed in sweet peas (Lathyrus odoratus) by Bateson, Saunders, and Punnett in 1905. Later, Morgan's experiments with Drosophila melanogaster (fruit flies) provided further evidence for linkage and recombination.
Parental Phenotypes: More common than recombinant phenotypes in crosses involving linked genes.
Crossing Over: Recombinants are produced by crossing-over during meiosis.
Gene Proximity: The closer two genes are, the more likely they are to remain together.
Gamete Ratios and Linkage Analysis
When genes are not linked, gametes are produced in a 1:1:1:1 ratio, resulting in equal frequencies of parental and recombinant genotypes. Deviations from this ratio indicate linkage.
No Linkage: 50% parental, 50% recombinant genotypes.
Partial/Complete Linkage: >50% parental and <50% recombinant genotypes.
Experimental Evidence and Mapping
Sturtevant's experiments with three traits (body color, eye color, wing length) in fruit flies demonstrated that all three genes were located on the same chromosome and tended to be transmitted together.
Crossover Events: The number of offspring without parental phenotype indicates crossover events.
Cis and Trans Conformations
Linked genes can be arranged in two conformations:
Cis (Coupling): AB/ab; parentals are AB and ab, recombinants are aB and Ab.
Trans (Repulsion): Ab/aB; parentals are Ab and aB, recombinants are AB and ab.
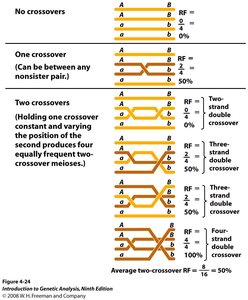
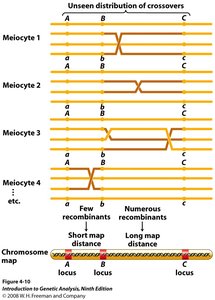
Crossovers and Recombination Frequency
Crossing over during meiosis leads to recombination between linked genes. The frequency of recombination is used to estimate the distance between genes.
Recombination Frequency (RF): Proportional to the physical distance between genes.
Map Unit (mu) or CentiMorgan (cM): 1% crossover rate equals 1 mu or 1 cM.
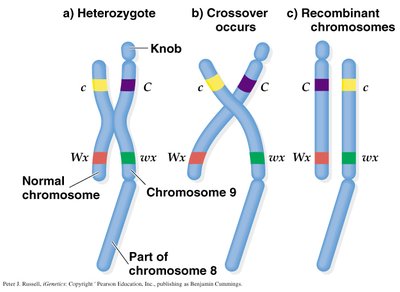
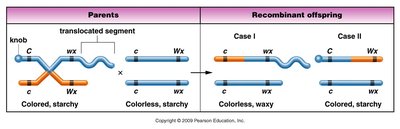
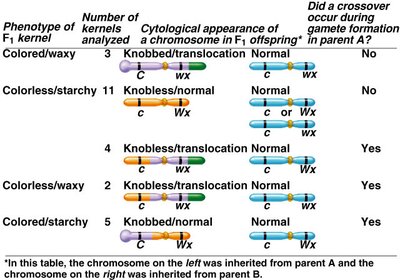
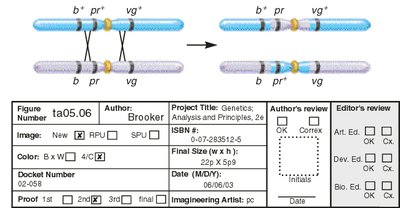
Creighton and McClintock's Corn Experiment
Creighton and McClintock provided cytological evidence for crossing over using corn chromosomes. They showed that physical exchange of chromosome segments corresponded to genetic recombination.
Testcrosses and Linkage Determination
Testcrosses are used to examine offspring of heterozygotes and determine linkage. The ratios of parental and recombinant offspring indicate the degree of linkage.
Complete Linkage: No recombinants observed.
Partial Linkage: Recombinants observed at lower frequency.
No Linkage: Equal frequency of all genotypes.
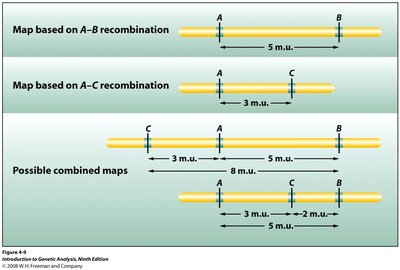
Genetic Maps and Distances
Sturtevant recognized that recombination frequencies could be used to create genetic maps. Map units are additive and represent relative distances between genes.
Distance Calculation:
Additivity: Map distances between genes are generally additive.
Two-Point and Three-Point Crosses
Genes are arranged linearly along chromosomes. Two-point crosses compare pairs of genes, while three-point crosses allow simultaneous analysis of several traits and determination of gene order.
Double Crossovers: Rare events; their frequency is the product of single crossover frequencies.
Gene Order: Double crossovers help determine the order of three genes.

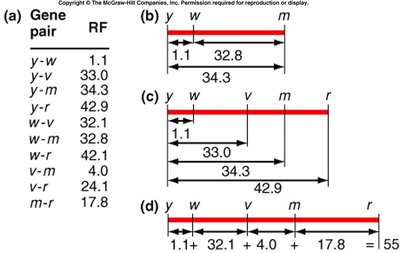
Calculating Recombination Frequencies
Recombination frequencies are calculated from testcross data. These values are used to construct genetic maps.
Example Calculation:
Map Construction: Distances between genes are calculated and mapped accordingly.
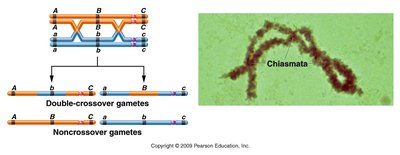
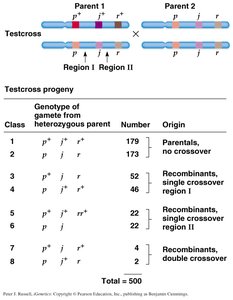
Three-Point Mapping Example
Three-point crosses are used to determine the order and distance between three genes. The combination of traits in double crossover offspring reveals which gene is in the middle.
Double Crossover: Separates the gene in the middle from the other two.
Map Distance Calculation: Both single and double crossovers are considered.

Interference and Coefficient of Coincidence
Interference is a genetic phenomenon where the occurrence of one crossover reduces the probability of another nearby crossover. It is quantified using the coefficient of coincidence (C) and interference (I).
Coefficient of Coincidence (C):
Interference (I):
Example: If 3 double crossovers are observed but 7.5 are expected, , (60% interference).
Summary Table: Types of Crosses and Mapping
Type of Cross | Purpose | Key Outcome |
|---|---|---|
Two-point cross | Compare two genes | Estimate distance |
Three-point cross | Analyze three genes | Determine gene order and distances |
Testcross | Detect linkage | Ratio of parental/recombinant |
Additional info: The notes above expand on the original content by providing definitions, formulas, and context for genetic mapping and linkage analysis, making the material self-contained and suitable for exam preparation.
