 Back
BackLinkage, Recombination, and Genetic Mapping: Study Guide
Study Guide - Smart Notes
 Tailored notes based on your materials, expanded with key definitions, examples, and context.
Linkage, Recombination, and Mapping
Linked Genes and Recombination
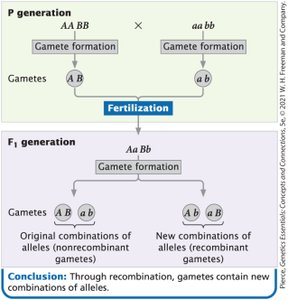
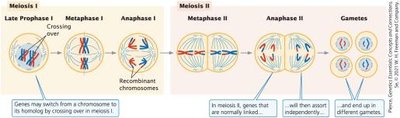
Linked genes are located close together on the same chromosome and tend to be inherited together. Recombination occurs when crossing-over between homologous chromosomes during meiosis creates new combinations of alleles.
Linked genes belong to the same linkage group and segregate together.
Crossing-over results in recombinant gametes, which contain new combinations of alleles.
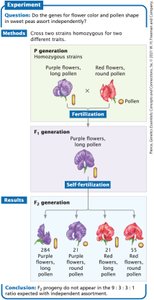
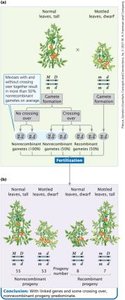
Phenotypic ratios in the F2 generation differ from the expected 9:3:3:1 ratio due to linkage.
More non-recombinant (parental) phenotypes are observed than recombinant phenotypes.
Recombination frequency is used to estimate the distance between genes.
Independent Assortment vs. Complete Linkage
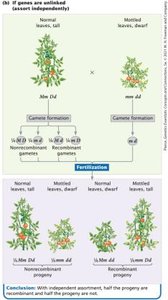
Independent assortment occurs when genes are on different chromosomes, resulting in equal probability of recombinant and non-recombinant gametes. Complete linkage occurs when genes are very close together on the same chromosome, preventing crossing-over and recombination.
Independent assortment: Genes segregate independently, producing a 1:1:1:1 ratio in testcross progeny.
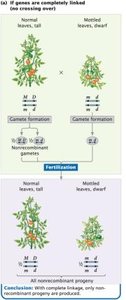
Complete linkage: Only non-recombinant gametes and progeny are produced.
Genes are rarely completely linked; most exhibit some recombination.
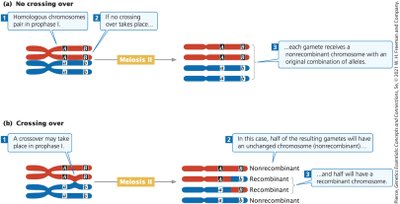
Crossing Over and Recombinant Gametes
Crossing-over during meiosis can separate linked genes, resulting in recombinant gametes. The frequency of recombinant gametes is proportional to the frequency of crossing-over events.
A crossover event between two loci results in half recombinant gametes.
Maximum proportion of recombinant gametes is 50%.
Recombination frequency is calculated as the number of recombinant progeny divided by the total number of progeny.
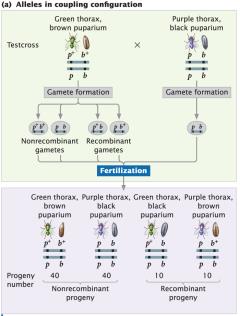
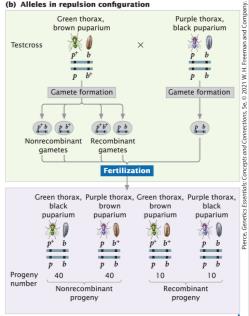
Coupling and Repulsion Configurations
Linked genes can be arranged in two configurations: coupling (cis) and repulsion (trans). The arrangement affects the frequency of recombinant and non-recombinant progeny in testcrosses.
Coupling (cis): Both wild-type alleles are on one chromosome; both mutant alleles are on the other.
Repulsion (trans): Wild-type allele of one locus is on the same chromosome as the mutant allele of the other locus.
Coupling configuration produces more non-recombinant progeny; repulsion produces more recombinant progeny.
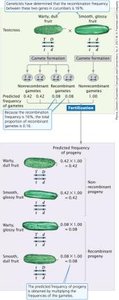
Predicting Progeny Frequencies in Crosses with Linked Genes
When genes are linked, the expected frequency of progeny can be predicted using the recombination frequency and the multiplication rule.
Recombination frequency indicates the proportion of recombinant gametes.
Each recombinant gamete type is produced at half the recombination frequency.
Predicted frequency of progeny is calculated by multiplying the probabilities of gametes from each parent.
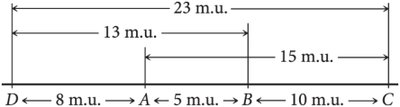
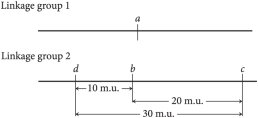
Genetic Maps and Map Units
Genetic maps are constructed based on recombination frequencies between genes. The distance between genes is measured in map units (m.u.) or centiMorgans (cM), where one map unit equals 1% recombination frequency.
Physical maps: Based on DNA sequence data, measured in base pairs (bp).
Genetic maps: Based on recombination frequencies, measured in map units.
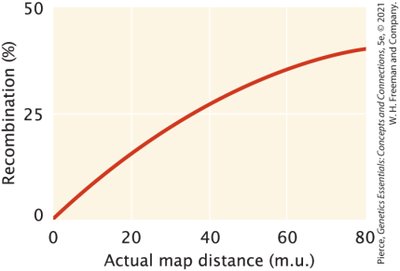
Map units are roughly additive, but actual physical distance may be underestimated for genes far apart.
Maximum recombination frequency is 50%.
Two-Point and Three-Point Test Crosses
Two-point crosses involve testcrosses with two genes, while three-point crosses involve three genes. Three-point crosses are more efficient for determining gene order and map distances.
Two-point cross: Testcross with two genes; recombination frequency is used to estimate distance.
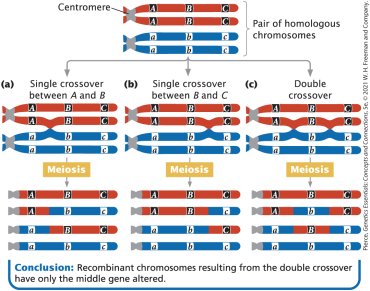
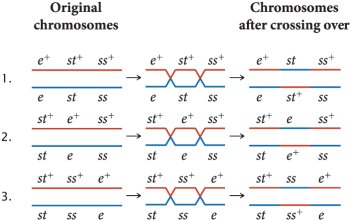
Three-point cross: Testcross with three genes; allows determination of gene order and detection of double crossovers.
Double crossover events are less frequent than single crossovers and can affect map distance calculations.
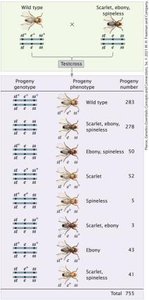
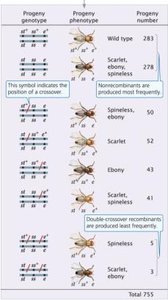
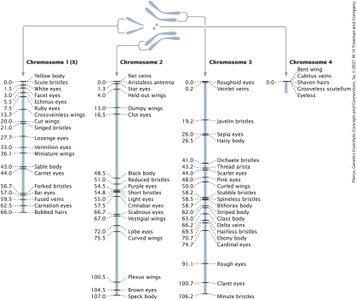
Three-Point Test Cross Example: Drosophila melanogaster
Three loci (eye color, body color, bristle size) are linked on chromosome 3. A three-point testcross produces eight possible progeny phenotypes, with non-recombinant progeny being the most common.
Gene order is determined by analyzing double-crossover progeny.
Double-crossover progeny are the least frequent.
Recombination frequencies between each pair of loci are calculated to construct the genetic map.


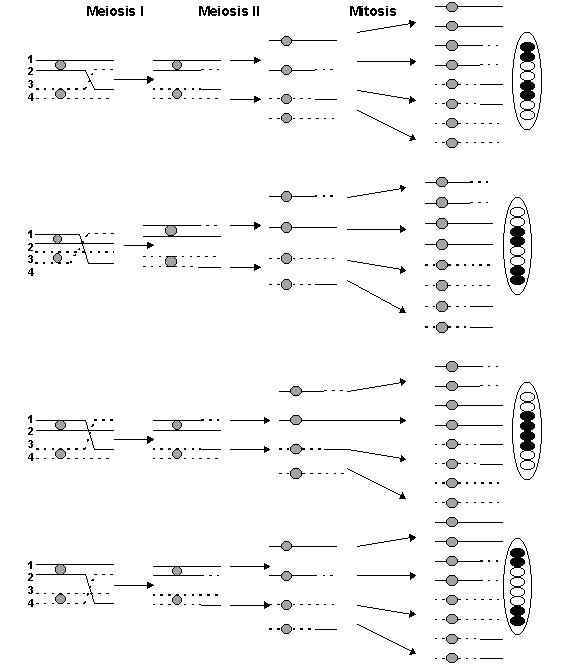
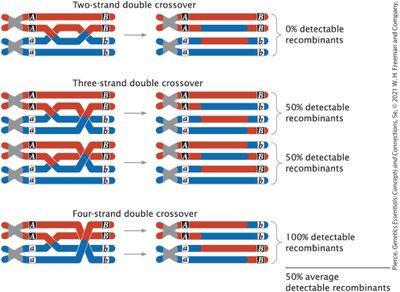
Multiple Crossovers and Map Distance Limitations
Multiple crossover events can occur between different pairs of chromatids in a tetrad, complicating genetic mapping. Recombination rates underestimate the true physical distance between genes at higher map distances.
Double crossovers can restore the original parental combination of alleles, making it appear as if no crossover occurred.
For genes far apart, genetic map distances are an underestimate of actual physical distance.
Maximum detectable recombination frequency is 50%.
Summary Table: Testcross Outcomes
The following table summarizes the expected outcomes of a testcross under different genetic scenarios:
Situation | Progeny of Testcross |
|---|---|
Independent assortment | Aa Bb (nonrecombinant): 25% aa bb (nonrecombinant): 25% Aa bb (recombinant): 25% aa Bb (recombinant): 25% |
Complete linkage (genes in coupling) | Aa Bb (nonrecombinant): 50% aa bb (nonrecombinant): 50% |
Linkage with some crossing over (genes in coupling) | Aa Bb (nonrecombinant): >50% aa bb (nonrecombinant): >50% Aa bb (recombinant): <50% aa Bb (recombinant): <50% |
Key Terms and Definitions
Linkage group: A set of genes located close together on the same chromosome.
Recombination frequency: The proportion of recombinant progeny produced in a cross.
Map unit (m.u.) / centiMorgan (cM): Unit of genetic distance; 1 m.u. = 1% recombination frequency.
Coupling (cis) configuration: Both wild-type alleles on one chromosome, both mutant alleles on the other.
Repulsion (trans) configuration: Wild-type allele of one locus on same chromosome as mutant allele of other locus.
Double crossover: Two crossover events between chromatids, which can restore parental allele combinations.
Formulas
Recombination frequency:
Map unit calculation:
Additional info:
Chi-square tests for independent assortment are not covered in this class, but are used to statistically evaluate linkage.
Physical maps and genetic maps may not always correspond due to multiple crossovers and limitations in detecting recombination.
