 Back
BackMendelian Genetics, Pedigrees, and Genetic Mapping: Study Guide
Study Guide - Smart Notes
 Tailored notes based on your materials, expanded with key definitions, examples, and context.
Mendelian Genetics
Design of Mendel’s Pea Experiments
Gregor Mendel’s experiments were foundational in understanding inheritance. He chose pea plants for their rapid growth, ability to self- or cross-pollinate, and clear, observable traits. Mendel focused on one trait at a time to simplify analysis and used true-breeding plants to ensure consistent results.
Key Point: Traits with two distinct forms (e.g., tall vs. dwarf, yellow vs. green) were selected.
Key Point: Controlled pollination allowed Mendel to decide which plants crossed.
Key Point: Large sample sizes enabled clear statistical patterns.
Example: Mendel’s use of thousands of pea plants to study inheritance of height and color.
Monohybrid Cross Outcomes (F1 and F2 Generations)
A monohybrid cross examines inheritance of a single trait with two alleles. Mendel’s crosses between true-breeding parents (e.g., AA × aa) produced predictable results in subsequent generations.
F1 Generation: All offspring are heterozygous (Aa) and display the dominant phenotype.
F2 Generation: Crossing F1 individuals (Aa × Aa) yields genotypes AA, Aa, and aa in a 1:2:1 ratio.
Phenotype Ratio: 3 dominant : 1 recessive.
Example: Tall (dominant) and dwarf (recessive) pea plants.
Genotypes for Heterozygous and Homozygous Organisms
Genotypes describe the allelic composition of an organism for a given gene.
Homozygous dominant: AA
Heterozygous: Aa
Homozygous recessive: aa
Punnett Square for Monohybrid Cross
Punnett Squares are used to predict the genotypes and phenotypes of offspring from a genetic cross.
Example: Cross between Aa × Aa
A a --------- A | AA | Aa a | Aa | aa
Test Cross to Determine Genotype
A test cross is used to determine whether an organism with a dominant phenotype is homozygous or heterozygous.
Method: Cross with a homozygous recessive (aa).
Interpretation: If any offspring show the recessive trait, the parent is heterozygous (Aa).
Independent Assortment and Chromosome Segregation
During meiosis, alleles for different genes segregate independently, leading to genetic variation.
Key Point: Genes on different chromosomes separate randomly.
Example: Parent genotype GgWw produces gametes GW, Gw, gW, gw.
Probability of Independent Events
The probability of two independent genetic events occurring together is the product of their individual probabilities.
Formula:
Example: Probability of GW gamete =
Dihybrid Crosses
A dihybrid cross tracks the inheritance of two different genes simultaneously.
Example: YyRr × YyRr (pea color and shape)
Phenotype Ratio: 9:3:3:1 (dominant both, dominant/recessive, recessive/dominant, recessive both)
Genotype Ratio: 1:2:1:2:4:2:1:2:1
Inferring Parent Genotypes from Offspring
Offspring ratios can be used to deduce parent genotypes in dihybrid crosses.
Key Point: Presence of recessive phenotypes indicates both parents carry recessive alleles.
Example: 9:3:3:1 ratio suggests both parents are heterozygous for both genes.
Pedigree Analysis
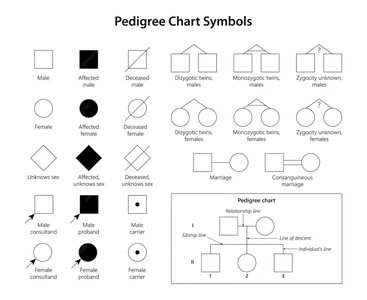
Pedigree Chart Symbols and Construction
Pedigrees use standardized symbols to represent family relationships and inheritance patterns. Understanding these symbols is essential for analyzing genetic traits.
Male: Square
Female: Circle
Carrier: Half-shaded
Affected: Fully shaded
Parents: Connected by a horizontal line
Identifying Carriers in Pedigrees
Carriers are individuals who possess one copy of a recessive allele but do not express the trait. Pedigrees can reveal carriers by analyzing affected offspring and unaffected parents.
Key Point: Unaffected individuals with affected offspring are likely carriers.
Example: X-linked recessive traits often have female carriers.
Inheritance of Sex-Linked Traits in Pedigrees
Sex-linked traits, especially those on the X chromosome, show distinct inheritance patterns in pedigrees.
X-linked recessive: More common in males; passed from carrier mother to son.
X-linked dominant: Affects both sexes; affected parent passes trait to about 50% of offspring.
Determining Genotypes from Pedigrees
Pedigrees can be used to deduce the genotypes of parents and offspring, especially for sex-linked traits.
Notation: Xa = normal allele, XA = affected allele
Males: XY (only one X allele matters)
Females: XX (can be carrier or affected)
Distinguishing Sex-Linked vs. Autosomal Inheritance
Pedigrees help differentiate between sex-linked and autosomal inheritance based on affected individuals’ sex and transmission patterns.
Sex-linked: Mostly males affected; no father-to-son transmission.
Autosomal: Both sexes equally affected; can pass from father to son.
Genetic Linkage and Mapping
Genetic Linkage
Genetic linkage refers to genes located close together on the same chromosome, which are inherited together more often than expected by independent assortment.
Key Point: Linked genes have recombination frequencies less than 50%.
Example: Genes for flower color and seed shape on the same chromosome.
Crossover Events and Chromosome Diagrams
Crossover events during meiosis result in exchange of genetic material between homologous chromosomes, producing recombinant gametes.
Key Point: Single crossover produces two parental and two recombinant chromatids.
Double crossover: The middle gene is flipped, helping determine gene order.
Predicting Gametes After Crossover
The location of crossover events determines the allele combinations in gametes.
No crossover: Only parental gametes produced.
Crossover: Recombinant gametes produced; trace crossover points to determine combinations.
Genetic Mapping Using Recombination Frequency
Genetic maps are constructed by measuring recombination frequencies between genes. The distance between genes is expressed in centimorgans (cM).
Formula:
Key Point: 1% recombination = 1 cM; higher recombination means genes are farther apart.
Gene Order Determination
Gene order on a chromosome is determined by comparing recombination frequencies and analyzing double crossover events.
Smallest recombination frequency: Closest genes.
Largest recombination frequency: Farthest apart.
Middle gene: Identified using double crossovers.
Genomic Mapping and Complex Traits
Complex Traits
Complex traits are influenced by multiple genes and environmental factors, making their inheritance patterns more complicated than simple Mendelian traits.
Examples: Height, skin color, disease risk.
Single Nucleotide Polymorphisms (SNPs)
SNPs are single base-pair differences in DNA sequence among individuals and serve as genetic markers in studies.
Example: A to G change at a specific position.
Identification of SNPs in the Lab
SNPs are identified using DNA sequencing or microarrays, which detect base changes at specific locations.
Method: DNA fragments bind to complementary sequences (hybridization).
SNP Mapping and Trait Association
SNP maps are used to identify SNPs associated with traits or diseases by comparing their frequency in affected versus unaffected individuals.
Key Point: SNPs appearing more often in people with a trait are likely linked to genes influencing that trait.
Genome-Wide Association Studies (GWAS)
GWAS require large sample sizes to detect real genetic patterns and avoid random chance, as complex traits often have small genetic effects.
Key Point: Studying thousands of people increases statistical power and accuracy.
