 Back
BackMendelian Genetics: Principles, Crosses, and Human Inheritance Patterns
Study Guide - Smart Notes
 Tailored notes based on your materials, expanded with key definitions, examples, and context.
Mendelian Genetics
Introduction to Mendelian Genetics
Mendelian genetics forms the foundation of classical genetics, based on the pioneering work of Gregor Mendel. Mendel developed a theory of inheritance before chromosomes were observed, earning him the title 'Father of Genetics.' His experiments with pea plants established the basic principles of heredity.
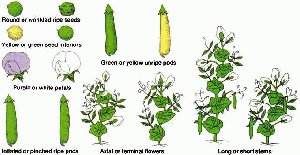
Key Point: Mendel used garden peas as a model organism due to their ease of cultivation, true-breeding strains, controlled matings, rapid growth, and observable characteristics with two distinct forms.
Key Point: Mendel tracked only characters with two corresponding traits, such as flower color and seed shape.
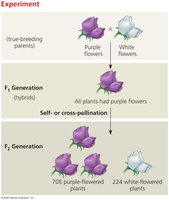
Example: Mendel's experiments involved crossing true-breeding purple-flowered peas with white-flowered peas and observing the inheritance patterns in subsequent generations.
Mendel’s Experimental Approach
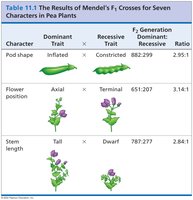
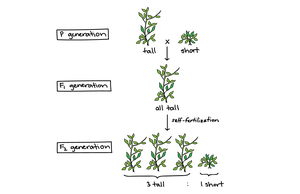
Mendel mated two contrasting, true-breeding varieties (P generation) and observed the resulting F1 and F2 generations. He consistently observed similar inheritance patterns across multiple traits.
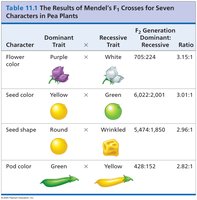
Key Point: The F1 generation consisted of hybrids, all displaying the dominant trait. The F2 generation showed a ratio of dominant to recessive phenotypes.
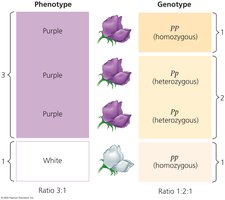
Example: In flower color, crossing purple (dominant) with white (recessive) resulted in all purple F1 offspring, but the F2 generation showed both purple and white flowers in a 3:1 ratio.
Mendel’s Model and Terminology
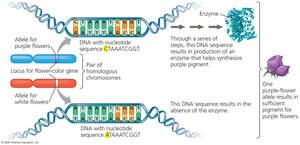
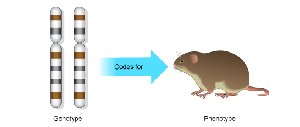
Mendel proposed that alternative versions of genes (alleles) account for variations in inherited characters. Each gene resides at a specific locus on a chromosome, and an organism inherits two alleles for each character, one from each parent.
Key Point: If the two alleles differ, the dominant allele determines the organism’s appearance, while the recessive allele has no noticeable effect.
Definitions:
Allele: Alternative form of a gene.
Phenotype: Physical expression of a trait.
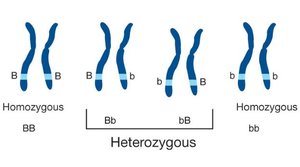
Genotype: Genetic makeup of an individual, represented by allele pairs (e.g., BB, Bb, or bb).
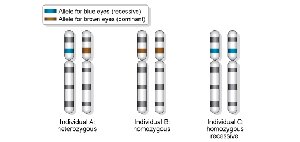
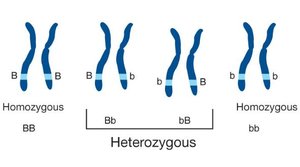
Homozygous: Two identical alleles (e.g., BB or bb).
Heterozygous: Two different alleles (e.g., Bb).
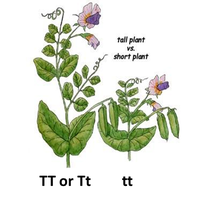
Example: For plant height, Tall (T) is dominant, Short (t) is recessive. Genotypes TT or Tt produce tall plants, while tt produces short plants.


Mendel’s Three Postulates
Mendel formulated three postulates to explain inheritance:
Unit factors exist in pairs: Every trait is controlled by two alleles.
Dominance/Recessiveness: In a pair, one allele can mask the other.
Segregation: Paired alleles separate independently during gamete formation.
Mendel’s Law of Segregation
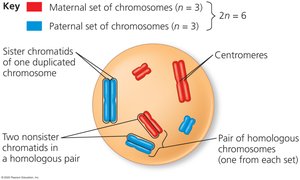
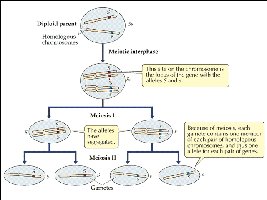
The Law of Segregation states that the two alleles for a gene separate when gametes are formed, corresponding to the separation of homologous chromosomes during meiosis I.
Key Point: Each gamete receives only one allele for each trait.
Monohybrid Crosses
A monohybrid cross examines the inheritance of a single trait. The Punnett Square method is used to predict genotypes and phenotypes of offspring.
Key Point: In a monohybrid cross, the F2 generation typically shows a 3:1 phenotypic ratio and a 1:2:1 genotypic ratio.
Example: Crossing AA (purple) with aa (white) produces all Aa (purple) in F1. Crossing Aa x Aa in F2 yields AA, Aa, and aa genotypes.


Test Cross
A test cross involves breeding an individual of unknown genotype with a homozygous recessive individual to reveal the genotype of the unknown organism.
Principle of Independent Assortment
The Principle of Independent Assortment states that alleles for one gene segregate independently of alleles for another gene during metaphase I of meiosis. This principle explains genetic variation in offspring.
Example: Hair color and hair texture genes segregate independently, producing various combinations in offspring.
Dihybrid Crosses
A dihybrid cross examines the inheritance of two traits at different loci. The FOIL method is used to determine possible gametes.
Key Point: The F2 generation of a dihybrid cross typically shows a 9:3:3:1 phenotypic ratio.
Example: Crossing RrYy x RrYy produces offspring with combinations of seed texture (R/r) and seed color (Y/y).
Trihybrid Crosses
A trihybrid cross examines three traits simultaneously. Segregation and independent assortment apply to all three pairs of alleles. The forked-line (branch) method is used to calculate offspring probabilities efficiently.
Key Point: The forked-line method splits each trait separately and multiplies probabilities to determine offspring ratios.
Example: For AaBbCc x AaBbCc, calculate each trait separately and combine probabilities instead of drawing a 64-box Punnett square.
Genetic Variation: Segregation, Independent Assortment, and Crossing Over
Segregation of homologous chromosomes during meiosis, independent assortment, and crossing over all contribute to extensive genetic variation in offspring.
Key Point: Each gamete receives a unique combination of alleles, and crossing over creates new allele combinations on the same chromosome.
Chi-Square Analysis and Null Hypothesis
The chi-square test determines if there is a significant difference between observed and expected frequencies in categorical data. It is used to assess whether deviations are due to chance or indicate a real effect.
Key Point: The null hypothesis assumes data fits the expected ratio, and any differences are due to random chance.
Factors: Independent assortment and sample size affect chi-square analysis.
Formula: The chi-square statistic is calculated as: where O = observed, E = expected.
Degrees of freedom: where n = number of phenotypic classes.
Pedigrees Reveal Patterns of Human Trait Inheritance
A pedigree is a family tree that shows how a trait is passed from one generation to the next. Pedigrees help identify which family members have the trait and their genetic makeup, revealing whether a trait is dominant, recessive, autosomal, or sex-linked.
Key Point: Pedigrees use standardized conventions: circles for females, squares for males, diamonds for unknown sex, and lines to indicate relationships.
Example: Identical twins are connected by a horizontal line, while fraternal twins are not.
Patterns of Inheritance in Pedigrees
Pedigrees can be used to distinguish between dominant and recessive traits, as well as autosomal and sex-linked inheritance.
Dominant: At least one parent has the trait; does not skip generations.
Recessive: Parents may not show the trait; can skip generations.
Autosomal: Males and females equally affected.
X-linked recessive: Males more often affected than females.
Autosomal Dominant vs. X-linked Dominant Traits
X-linked dominant: Affects both sexes, often more females. All daughters of affected males have the trait; no male-to-male transmission.
Autosomal dominant: Affects both sexes equally; affected individuals usually have at least one affected parent.
Autosomal Recessive vs. X-linked Recessive Traits
Autosomal recessive: Can skip generations; affects both sexes equally; more likely to appear in siblings.
X-linked recessive: More common in males; affected males cannot pass the trait to sons, only daughters (who become carriers); trait can skip generations through carrier females.
