 Back
BackCh 3 Mendelian Genetics: Principles, Crosses, and Pedigree Analysis
Study Guide - Smart Notes
 Tailored notes based on your materials, expanded with key definitions, examples, and context.
Chapter 3: Mendelian Genetics
Introduction to Mendelian Genetics
Mendelian genetics forms the foundation of classical genetics, describing how traits are inherited from one generation to the next. Gregor Mendel's experiments with Pisum sativum (garden peas) in 1866 established the concept of discrete units of inheritance, now known as genes. The field of transmission genetics emerged from relating Mendel's findings to chromosomal behavior during meiosis.
Mendel’s Experimental Methodology
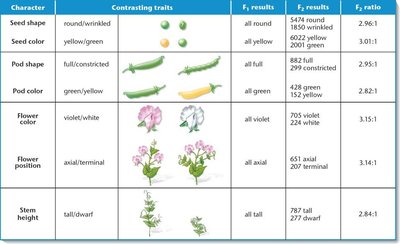
Mendel's success was due to his careful experimental design and choice of a suitable model organism. He studied seven visible features, each with two contrasting forms (traits), such as seed shape, seed color, pod shape, pod color, flower color, flower position, and stem height.
Key Points:
Model organism: Garden pea (Pisum sativum).
Traits studied: Each character had two contrasting forms.
Monohybrid cross: Crosses involving only one pair of contrasting traits.
Monohybrid Crosses and Mendel’s Postulates
A monohybrid cross involves mating true-breeding individuals for a single trait. Mendel observed that the first filial (F1) generation displayed only one of the parental traits, while the second filial (F2) generation showed a 3:1 ratio of dominant to recessive traits.
Mendel’s First Three Postulates:
Unit factors in pairs: Genetic characters are controlled by unit factors (genes) existing in pairs.
Dominance/recessiveness: In a pair of unlike unit factors, one is dominant and the other is recessive.
Segregation: Paired unit factors segregate randomly during gamete formation.
Modern Genetic Terminology
Modern genetics uses specific terminology to describe Mendel’s findings:
Gene: The unit of inheritance; exists in alternative forms called alleles.
Genotype: The genetic makeup of an individual (e.g., DD, Dd, dd).
Phenotype: The observable trait (e.g., tall or dwarf).
Homozygous: Identical alleles (DD or dd).
Heterozygous: Different alleles (Dd).
Punnett Squares
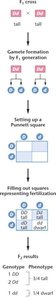
The Punnett square is a visual tool to predict the genotypes and phenotypes resulting from a genetic cross. It displays all possible combinations of parental gametes and their outcomes.
The Testcross
A testcross determines whether an individual displaying a dominant phenotype is homozygous or heterozygous. This is done by crossing the individual with a homozygous recessive partner and analyzing the offspring.
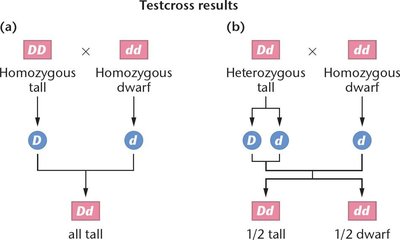
If all offspring display the dominant trait, the tested individual is likely homozygous.
If offspring show a 1:1 ratio of dominant to recessive traits, the tested individual is heterozygous.
Dihybrid Crosses and Independent Assortment
A dihybrid cross examines the inheritance of two pairs of contrasting traits simultaneously. Mendel’s fourth postulate, the Law of Independent Assortment, states that alleles of different genes assort independently during gamete formation.
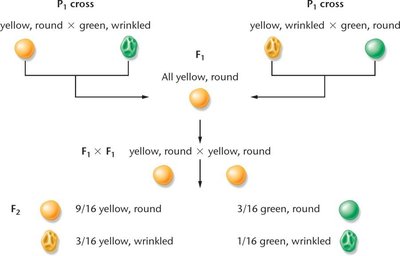
Phenotypic ratio: The F2 generation shows a 9:3:3:1 ratio for two traits.
Product Law of Probability
The product law states that the probability of two or more independent events occurring together is the product of their individual probabilities. This law is used to predict the outcomes of genetic crosses involving multiple traits.
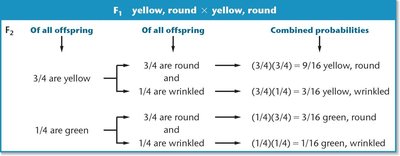
Example: Probability of yellow and round seeds in F2 = (3/4 yellow) × (3/4 round) = 9/16.
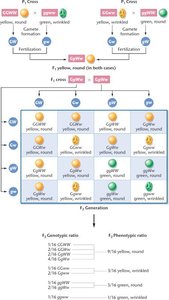
Dihybrid Cross Punnett Square
The Punnett square for a dihybrid cross illustrates all possible combinations of alleles for two traits, confirming the 9:3:3:1 phenotypic ratio in the F2 generation.
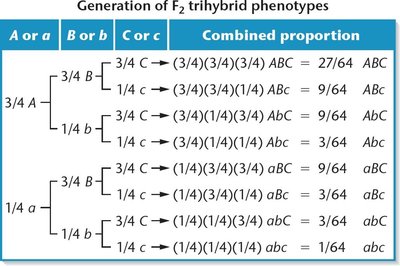
Trihybrid Crosses and the Forked-Line Method
Trihybrid crosses involve three pairs of contrasting traits. The forked-line (branch) method simplifies the calculation of phenotypic ratios for crosses involving multiple gene pairs, assuming independent assortment.
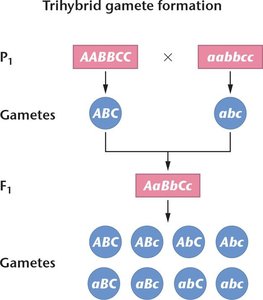
Genetic Variation from Independent Assortment
Independent assortment generates extensive genetic diversity. The number of possible gametes is given by , where n is the haploid chromosome number. For humans (n = 23), over 8 million different gametes are possible.
Genetic Ratios and Probability
Genetic ratios, such as 3/4 tall or 1/4 dwarf, are expressed as probabilities. These probabilities help predict the outcomes of genetic crosses and are subject to random fluctuation due to chance events.
Pedigree Analysis
Pedigrees are family trees that track the inheritance of specific traits across generations. They are essential for studying inheritance patterns in humans, where controlled crosses are not possible.
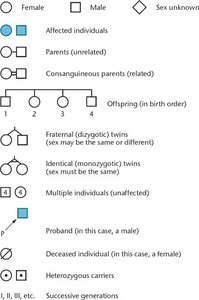
Symbols: Circles for females, squares for males, diamonds for unknown sex.
Shading: Indicates expression of the phenotype.
Carriers: Heterozygous individuals may be marked with a dot.
Twins: Indicated by diagonal lines; identical twins are connected by a horizontal line.
Proband: The individual for whom the pedigree is constructed.
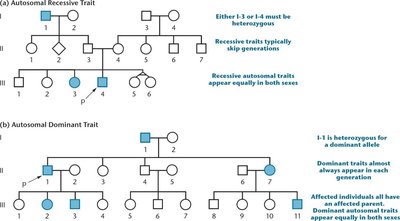
Patterns of Inheritance in Pedigrees
Pedigree analysis can reveal autosomal recessive and autosomal dominant inheritance patterns. Autosomal recessive traits often skip generations, while autosomal dominant traits appear in every generation.
Case Study: Tay–Sachs Disease
Tay–Sachs disease (TSD) is a recessive genetic disorder caused by a mutation in the gene encoding Hexosaminidase A (Hex-A). The absence of functional Hex-A leads to the accumulation of ganglioside GM2 in neurons, resulting in nervous system degeneration. One wild-type allele is sufficient for normal development.
Inheritance: Autosomal recessive.
Biochemical basis: Loss of Hex-A activity prevents breakdown of ganglioside GM2.
