 Back
Mendelian Inheritance and the Cellular Basis of Genetics
Study Guide - Smart Notes
 Tailored notes based on your materials, expanded with key definitions, examples, and context.
Single Inheritance Patterns and Mendel’s Experiments
Introduction to Mendelian Genetics
Mendelian genetics forms the foundation of classical genetics, focusing on how traits are inherited from one generation to the next. Gregor Mendel’s experiments with pea plants established the basic principles of inheritance, including the concepts of dominant and recessive traits, segregation, and independent assortment.
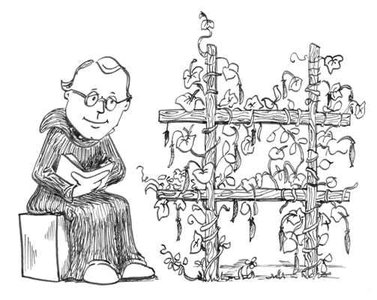
Mendel’s Experimental Design
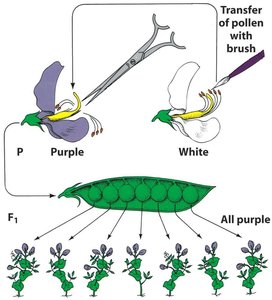
Mendel used pea plants (Pisum sativum) for his experiments due to their ability to self-fertilize and cross-fertilize, as well as their distinct, easily observable traits. He carefully controlled pollination to study inheritance patterns.
Self-fertilization (selfing): The plant fertilizes itself, ensuring genetic consistency.
Cross-fertilization (cross breeding): Pollen from one plant fertilizes another, allowing for controlled genetic crosses.
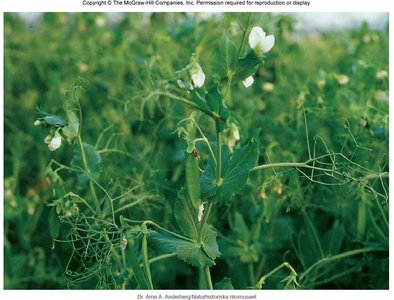
Key Anatomical Features of Pea Plants
Pistil: Female reproductive organ, includes stigma, style, and ovary.
Stamen: Male reproductive organ, includes anther (pollen-producing) and filament (support).
Phenotypic Traits Studied by Mendel
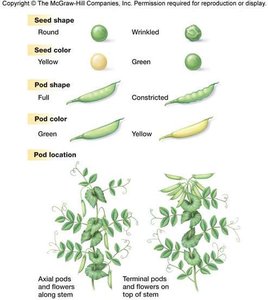
Mendel selected traits with discrete, binary phenotypes, such as seed shape (round/wrinkled), seed color (yellow/green), pod shape (full/constricted), pod color (green/yellow), and plant height (tall/dwarf).
Monohybrid Crosses
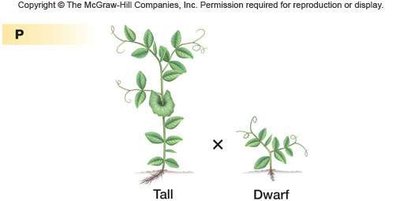
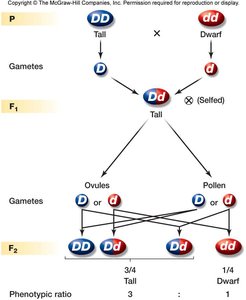
Monohybrid crosses involve parents that differ in a single trait. Mendel crossed pure-breeding (homozygous) tall and dwarf plants (P generation) and observed the F1 and F2 generations.
P generation: Pure-breeding parents (e.g., tall × dwarf).
F1 generation: All offspring were tall, indicating dominance of the tall trait.
F2 generation: Self-crossing F1 plants yielded a 3:1 ratio of tall to dwarf plants.
Quantitative Results of Mendel’s Crosses
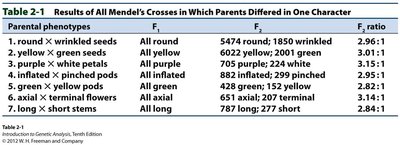
Mendel’s experiments consistently produced a 3:1 phenotypic ratio in the F2 generation for all seven traits he studied. This supported the concept of dominant and recessive alleles.
Parental Phenotypes | F1 | F2 | F2 Ratio |
|---|---|---|---|
Round × Wrinkled seeds | All round | 5474 round; 1850 wrinkled | 2.96:1 |
Yellow × Green seeds | All yellow | 6022 yellow; 2001 green | 3.01:1 |
Purple × White petals | All purple | 705 purple; 224 white | 3.15:1 |
Inflated × Pinched pods | All inflated | 882 inflated; 299 pinched | 2.95:1 |
Green × Yellow pods | All green | 428 green; 152 yellow | 2.82:1 |
Axial × Terminal flowers | All axial | 651 axial; 207 terminal | 3.14:1 |
Long × Short stems | All long | 787 long; 277 short | 2.84:1 |
Modern Conclusions from Mendel’s Work
Genes: Hereditary factors necessary for producing phenotypes.
Alleles: Different forms of a gene; each diploid organism has two alleles per gene.
Dominance: The dominant allele determines the phenotype in heterozygotes; the recessive allele is masked but can be inherited.
Genotype vs. Phenotype: Genotype refers to the genetic makeup (e.g., YY, Yy, yy), while phenotype is the observable trait.
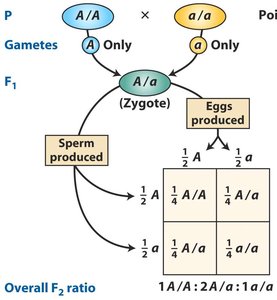
Law of Segregation: During gamete formation, the two alleles for a gene separate so that each gamete receives only one allele.
Random Fertilization: Gametes fuse randomly, restoring diploidy.
Principles of Mendel’s First Law (Law of Segregation)
Genes exist in pairs in diploid organisms.
Each gamete carries only one member of each gene pair.
Fertilization is random, restoring the gene pair in the offspring.
The observed 3:1 phenotypic ratio in the F2 generation corresponds to a 1:2:1 genotypic ratio (homozygous dominant : heterozygous : homozygous recessive).
Testcrosses and the Law of Segregation
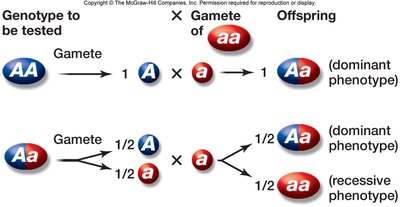
A testcross is used to determine the genotype of an individual expressing the dominant phenotype by crossing it with a homozygous recessive individual. The resulting offspring phenotypes reveal the unknown genotype.
If all offspring display the dominant phenotype, the tested individual is likely homozygous dominant.
If offspring display a 1:1 ratio of dominant to recessive phenotypes, the tested individual is heterozygous.
Cellular Basis of Mendelian Inheritance: Meiosis
Overview of Meiosis
Meiosis is the process by which diploid cells produce haploid gametes, ensuring genetic diversity and the maintenance of chromosome number across generations. It consists of two sequential divisions: Meiosis I and Meiosis II.
Meiosis I: Homologous chromosomes separate, reducing chromosome number by half.
Meiosis II: Sister chromatids separate, similar to mitosis.
Prophase I: Leptonema and Zygonema
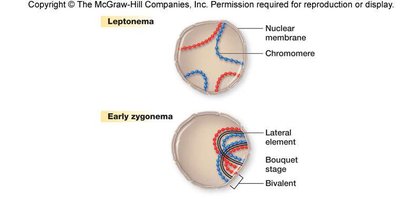
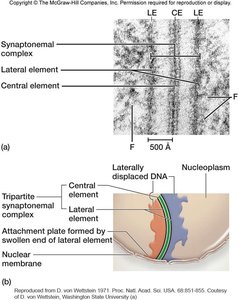
During early prophase I, chromosomes condense and homologous chromosomes begin to pair (synapsis), forming bivalents. The synaptonemal complex forms, facilitating recombination.
Prophase I: Pachynema and Recombination
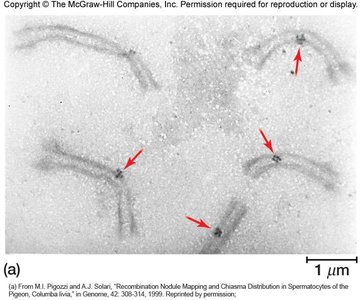
Recombination (crossing over) occurs between nonsister chromatids, resulting in genetic exchange and increased diversity. Recombination nodules are enzymatic sites where crossing over takes place.
Diplonema and Diakinesis
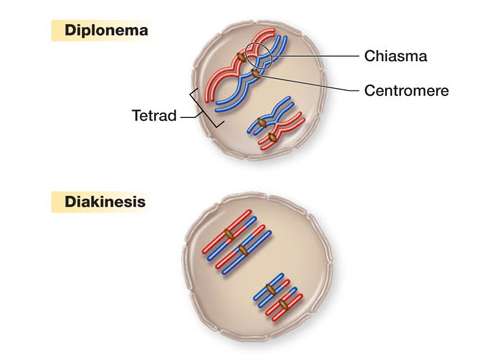
In diplonema, the synaptonemal complex disintegrates, but homologs remain attached at chiasmata, the sites of crossing over. During diakinesis, homologs continue to separate, and the nuclear envelope breaks down in preparation for metaphase I.
Metaphase I and Anaphase I
During metaphase I, tetrads align at the metaphase plate. In anaphase I, homologous chromosomes (not sister chromatids) are separated and pulled to opposite poles, reducing the chromosome number by half (reductional division).
Centrosomes and Microtubule Organization
The centrosome (microtubule organizing center, MTOC) organizes spindle fibers during cell division. Microtubules are dynamic polymers composed of α- and β-tubulin subunits, with polarity that directs chromosome movement.
The (-) end is anchored at the centrosome; the (+) end extends toward the cell periphery.
Spindle fibers attach to chromosomes at kinetochores during mitosis and meiosis.
Summary of Meiosis
Meiosis reduces the diploid chromosome number by half, producing four genetically unique haploid cells.
Random alignment of tetrads and recombination during prophase I generate genetic diversity.
Mendel’s Law of Independent Assortment (covered in a future chapter) is explained by the random orientation of homologous pairs during metaphase I.
Key Equation:
