 Back
BackPatterns of Inheritance: Single-Gene Traits and Mendelian Genetics
Study Guide - Smart Notes
 Tailored notes based on your materials, expanded with key definitions, examples, and context.
Patterns of Inheritance: Single-Gene Traits
Key Concepts in Genetics
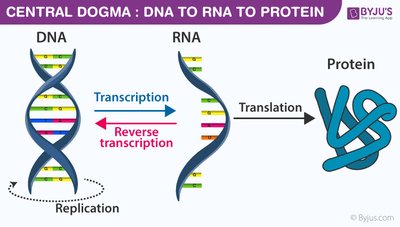
This section introduces foundational concepts in genetics, focusing on the molecular and chromosomal basis of heredity, Mendelian inheritance, and the application of these principles to pedigree analysis.
Gene: A segment of DNA that encodes a functional product, typically a protein.
Allele: Alternative forms of a gene found at the same locus on homologous chromosomes.
Chromosome: Threadlike structure of DNA and proteins carrying genetic information in the form of genes.
Locus: The specific physical location of a gene on a chromosome.
Homologous Chromosomes: Chromosomes similar in structure, size, and gene composition, with one inherited from each parent.
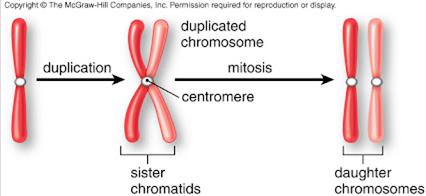
Chromosome Structure and Analogy
Chromosomes can be unreplicated (single DNA molecule) or replicated (two sister chromatids). An analogy compares a chromosome to a dresser, with each drawer representing a locus, the item category as a gene, and the specific item as an allele.


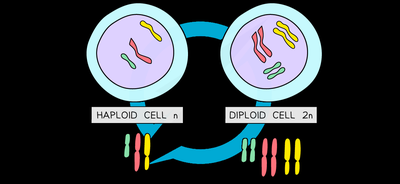
Homologous Chromosomes and Ploidy
Homologous chromosomes are paired in diploid organisms (2n), with one set from each parent. Haploid cells (n) contain only one chromosome from each homologous pair. Chromosome numbers are often expressed as haploid (n) or diploid (2n) values.
Diploid (2n): Two sets of chromosomes (one from each parent).
Haploid (n): One set of chromosomes (as in gametes).
Genotype and Phenotype
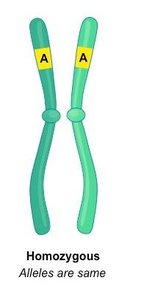
The genotype refers to the genetic constitution (alleles present), while the phenotype is the observable trait resulting from genotype and environment. For a given gene, individuals can be:
Homozygous: Two identical alleles at a locus (e.g., AA or aa).
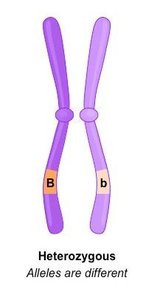
Heterozygous: Two different alleles at a locus (e.g., Aa).
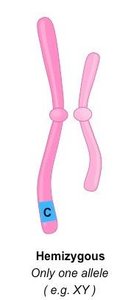
Hemizygous: Only one allele present (e.g., genes on X chromosome in XY males).
Mendelian Genetics
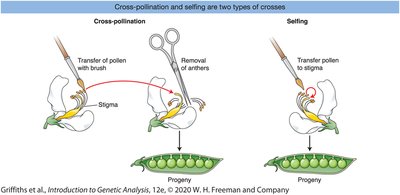
Historical Context and Mendel's Experiments
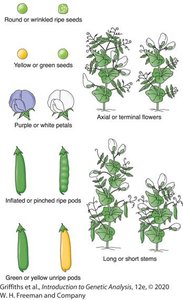
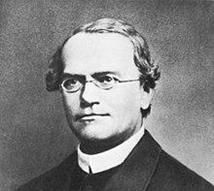
Gregor Mendel, the 'Father of Genetics,' used pea plants to study inheritance, challenging the prevailing Blending Inheritance theory. Mendel's experiments demonstrated that traits are inherited as discrete units (genes), not blended.
Mendel's Laws and Experimental Results
Law of Segregation: Each individual has two alleles for each gene, which segregate during gamete formation, so each gamete receives only one allele.
Law of Dominance: In heterozygotes, one allele may mask the expression of another (dominant vs. recessive).
Mendel observed a 3:1 phenotypic ratio in the F2 generation for several traits, contradicting blending inheritance predictions.
Dominant and Recessive Alleles
Dominant allele: Expressed in the phenotype if present (homozygous or heterozygous).
Recessive allele: Expressed only if both alleles are recessive (homozygous recessive).
Examples include human disorders such as polydactyly (dominant) and cystic fibrosis (recessive).
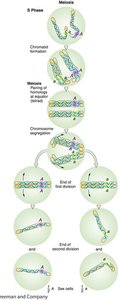
Chromosomal and Molecular Basis of Mendelian Principles
Meiosis explains Mendel's laws: homologous chromosomes (and thus alleles) segregate into gametes. Fertilization restores diploidy.
Punnett Squares and Probability
Punnett squares are used to predict the genotypic and phenotypic ratios of offspring from parental crosses. For a monohybrid cross (Yy x Yy):
Genotypic ratio: 1 YY : 2 Yy : 1 yy
Phenotypic ratio: 3 yellow : 1 green (if yellow is dominant)
Alleles, Mutations, and Phenotypes
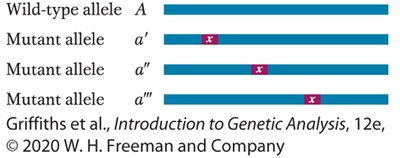
Origin and Diversity of Alleles
Alleles arise from mutations in the DNA sequence of a gene. Multiple alleles can exist for a single gene, leading to genetic diversity.
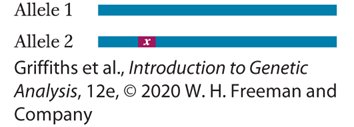
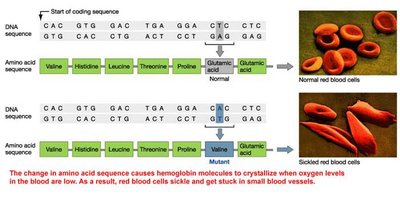
Relationship Between Alleles and Phenotypes
Protein differences resulting from allelic variation can lead to different phenotypes. Some mutations are silent (no effect), while others can cause loss or gain of function.
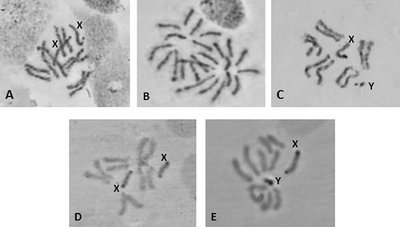
Sex-Linked Inheritance
Sex Chromosomes and Inheritance Patterns
Some traits are linked to sex chromosomes (X or Y). In mammals and Drosophila:
X/X: Female (homogametic)
X/Y: Male (heterogametic)
X-Linked and Y-Linked Traits
X-linked traits: Show dominant/recessive patterns in females; males express the allele present on their single X chromosome.
Y-linked traits: Only affect males; all sons of an affected male will be affected.
Examples: Red-green color blindness, hemophilia A (X-linked); SRY gene (Y-linked).
Pedigree Analysis
Pedigree Symbols and Interpretation
Pedigrees are diagrams that show the inheritance of traits across generations. They use standardized symbols to represent individuals and relationships.
Determining Inheritance Patterns from Pedigrees
Y-linked: Only males affected; passed from father to all sons.
X-linked dominant: All daughters of affected males affected; sons affected only if mother is affected.
X-linked recessive: All sons of affected mothers affected; daughters affected only if father is affected.
Autosomal dominant: Trait appears in every generation; affected individuals have at least one affected parent.
Autosomal recessive: Trait can skip generations; affected individuals can have unaffected parents.
Steps in Pedigree Analysis
Determine if the trait is dominant or recessive.
Assess if the trait is autosomal or sex-linked.
Mark known genotypes and work backward to deduce unknowns.
Ensure the proposed inheritance pattern fits all observed crosses.
Summary Table: Types of Inheritance Patterns
Pattern | Key Features | Example |
|---|---|---|
Autosomal Dominant | Appears in every generation; both sexes equally affected | Polydactyly |
Autosomal Recessive | Can skip generations; both sexes equally affected | Cystic fibrosis |
X-linked Dominant | All daughters of affected males affected; sons only if mother affected | Rett syndrome |
X-linked Recessive | All sons of affected mothers affected; daughters only if father affected | Hemophilia A |
Y-linked | Only males affected; passed from father to all sons | SRY gene |
