 Back
Polygenic Inheritance, Complementation, and Epistasis: Advanced Genetics Study Notes
Study Guide - Smart Notes
 Tailored notes based on your materials, expanded with key definitions, examples, and context.
Polygenic Inheritance
Definition and Characteristics
Polygenic inheritance refers to the phenomenon where multiple genes collectively influence a single phenotype. Unlike Mendelian traits, which are typically all-or-none, polygenic traits exhibit continuous variation.
Key Point 1: Polygenic traits include height, skin color, and eye color in humans.
Key Point 2: These traits are more complex to analyze than Mendelian traits due to the involvement of multiple genes.
Key Point 3: Polygenic inheritance is responsible for continuous variation in populations.
Key Point 4: Identifying the genes involved often requires mutagenesis and complementation analysis.
Complementation Analysis
Purpose and Methodology
Complementation analysis is a genetic tool used to determine whether mutations producing similar phenotypes are in the same gene or in different genes.
Key Point 1: Biologists screen for mutants with similar phenotypes to study a biological process.
Key Point 2: The main questions are: Are the mutations in the same gene or different genes? How many genes are involved?
Key Point 3: Complementation occurs when two mutants with similar phenotypes produce a wild-type phenotype when crossed, indicating mutations in different genes.
Key Point 4: Failure to complement (mutant phenotype persists) indicates mutations in the same gene.
Scenario 1: Mutations in the Same Gene
Key Point: Crossing two mutants (e.g., c1c1 and c2c2) results in a mutant phenotype in the F1 generation (c1c2), indicating both mutations are in the same gene.
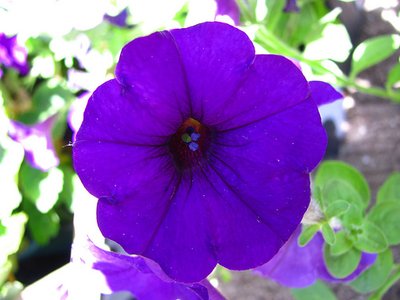
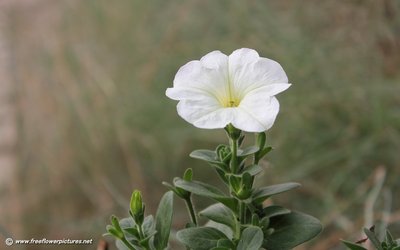
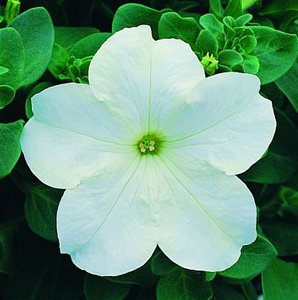
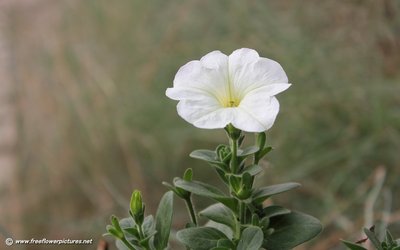
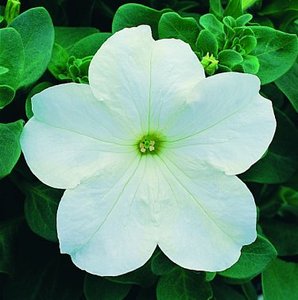
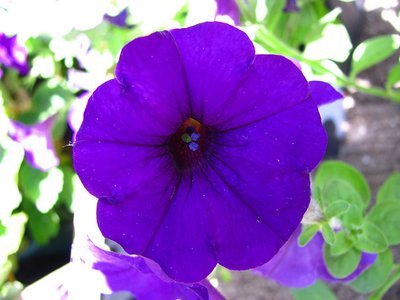
Example: Wild-type flower is purple, but both mutants produce white flowers. Crossing them does not restore the purple color.
Scenario 2: Mutations in Different Genes
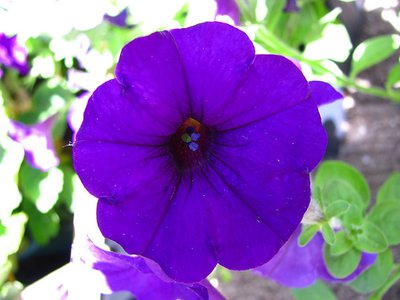
Key Point: Crossing two mutants (e.g., ccPP and CCpp) results in a wild-type phenotype in the F1 generation (CcPp), indicating mutations are in different genes.
Example: Both mutants produce white flowers, but the F1 offspring are purple, showing complementation.
Complementation Table: Determining Gene Number
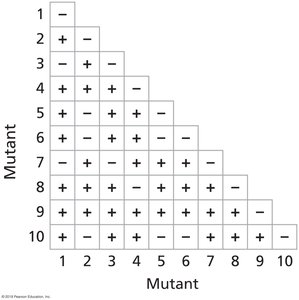
Key Point: A complementation table summarizes the results of crossing different mutants. The number of groups that fail to complement indicates the number of genes involved.
Mutant | 1 | 2 | 3 | 4 | 5 | 6 | 7 | 8 | 9 | 10 |
|---|---|---|---|---|---|---|---|---|---|---|
1 | - | - | - | - | - | + | + | + | + | + |
2 | - | - | - | - | + | + | + | + | + | |
3 | - | - | - | + | + | + | + | + | ||
4 | - | - | + | + | + | + | + | |||
5 | - | + | + | + | + | + | ||||
6 | - | - | - | - | - | |||||
7 | - | - | - | - | ||||||
8 | - | - | - | |||||||
9 | - | - | ||||||||
10 | - |
Application in Human Disease
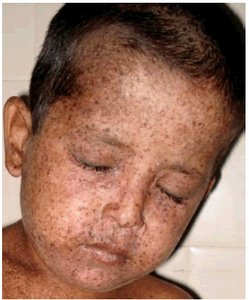
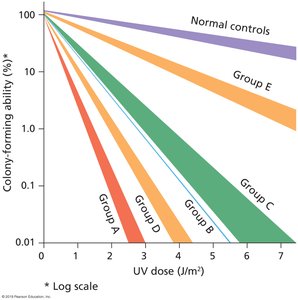
Key Point: Complementation analysis is used to study genetic diseases such as Xeroderma Pigmentosum, which involves mutations in multiple genes responsible for DNA repair.
Example: Different complementation groups correspond to different genes involved in the disease.
Epistasis
Definition and Genetic Interactions
Epistasis occurs when the allele at one gene locus masks or modifies the phenotypic expression of alleles at another locus. This interaction alters the expected phenotypic ratios in dihybrid crosses.
Key Point 1: Two or more gene loci control the same trait.
Key Point 2: The allele at one locus can hide the genotype at another locus.
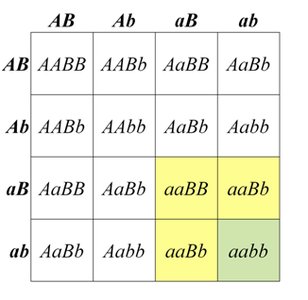
Key Point 3: Dihybrid crosses produce modified phenotypic ratios, not the classic 9:3:3:1.
Key Point 4: Genotypic ratios remain unchanged; only phenotypes are affected.
Types of Epistatic Interactions
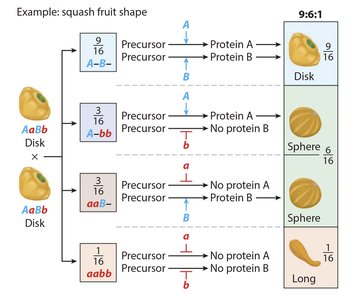
Dominant Interaction (9:6:1 Ratio)
Key Point: Both dominant alleles produce the same phenotype in the presence of recessive alleles at the other gene.
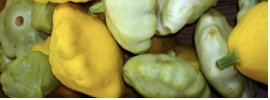
Example: Squash fruit shape: Disk (9/16), Sphere (6/16), Long (1/16).
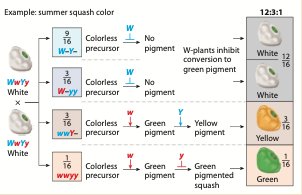
Dominant Epistasis (12:3:1 Ratio)
Key Point: A dominant allele at one locus masks the expression of alleles at a second locus.
Example: Summer squash color: White (12/16), Yellow (3/16), Green (1/16).
Recessive Epistasis (9:3:4 Ratio)
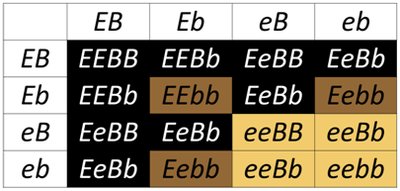
Key Point: A homozygous recessive allele at one locus masks the expression of alleles at another locus.
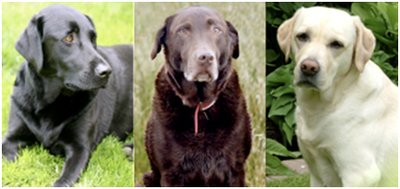
Example: Labrador retriever coat color: Black (9/16), Chocolate (3/16), Yellow (4/16).
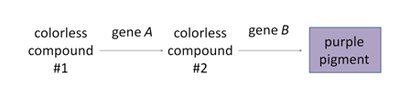
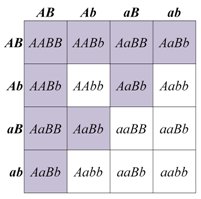
Complementary Epistasis (9:7 Ratio)
Key Point: Homozygous recessive alleles at either locus mask the expression at the other locus.
Example: Flower color: Purple (9/16), Colorless (7/16).
Duplicate Epistasis (15:1 Ratio)
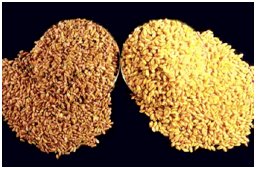
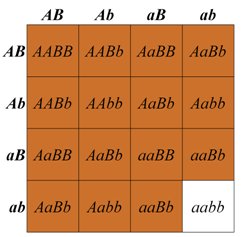
Key Point: Wild-type phenotype is produced if either locus has a dominant allele; only double recessive produces mutant phenotype.
Example: Red pigment (15/16), White (1/16).
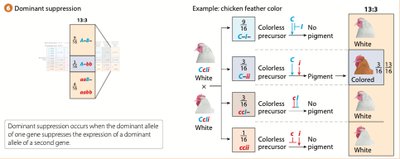
Dominant Suppression (13:3 Ratio)
Key Point: The dominant allele at one locus suppresses the expression of a dominant allele at another locus.
Example: Chicken feather color: White (13/16), Colored (3/16).
Epistasis: Key Facts and Applications
Key Point 1: Epistasis does not alter genotypic ratios, only phenotypic ratios.
Key Point 2: Epistasis can be detected using a chi-squared test.
Key Point 3: Many types of epistatic interactions exist, each with characteristic phenotypic ratios.
Key Point 4: Epistasis cannot occur when only a single gene controls a phenotype.
Example Problem: Morning Glory Flower Color
Genetic Cross and Phenotypic Ratio
Morning glories can be blue, purple, or red depending on alleles at two loci, A and B:
A_B_: blue
A_bb or aa B_: purple
aa bb: red
If two Aa Bb plants are crossed, the phenotypic ratio is:
Blue: 9/16
Purple: 6/16
Red: 1/16
*Additional info: This is an example of dominant interaction epistasis, producing a 9:6:1 ratio.*
