 Back
BackPopulation Genetics and Evolutionary Processes: Study Notes
Study Guide - Smart Notes
 Tailored notes based on your materials, expanded with key definitions, examples, and context.
Populations & Gene Pools
Definitions and Concepts
Population genetics studies the genetic composition of groups of interbreeding individuals and how it changes over time. A population is a group of interbreeding organisms, while a gene pool is the collection of all genes and alleles present in the members of a population. Each individual carries a portion of the gene pool in its genome. The distribution of alleles and genotypes in a population is influenced by mating patterns and evolutionary processes, which determine how alleles are dispersed and their frequencies in subsequent generations.
Hardy-Weinberg Equilibrium
Assumptions and Predictions
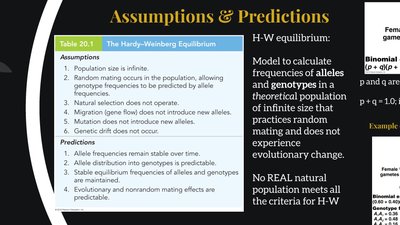
The Hardy-Weinberg equilibrium is a foundational model in population genetics used to calculate allele and genotype frequencies in a theoretical population that is infinitely large, practices random mating, and does not experience evolutionary change. The model is based on several key assumptions:
Population size is infinite.
Random mating occurs, allowing genotype frequencies to be predicted by allele frequencies.
No natural selection, mutation, or migration occurs.
Genetic drift does not occur.
Predictions of the model include stable allele frequencies over time, predictable genotype distributions, and the ability to distinguish evolutionary and nonrandom mating effects.
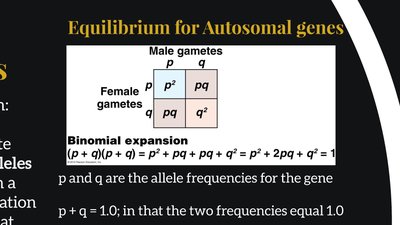
Equilibrium for Autosomal Genes
For a gene with two alleles (p and q), the Hardy-Weinberg equation is:
Where:
p = frequency of one allele
q = frequency of the other allele
p + q = 1
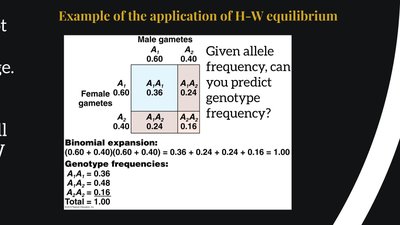
Application Example
Given allele frequencies, genotype frequencies can be predicted. For example, if p = 0.6 and q = 0.4:
Frequency of homozygote (A1A1):
Frequency of heterozygote (A1A2):
Frequency of homozygote (A2A2):
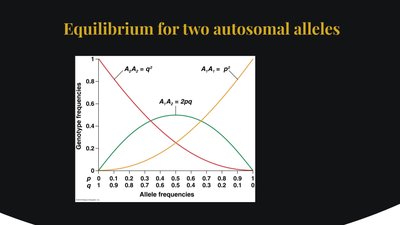
Equilibrium for Two Autosomal Alleles
The relationship between allele frequencies and genotype frequencies can be visualized graphically. As the frequency of one allele increases, the frequency of the corresponding homozygote increases, while the heterozygote frequency peaks when both alleles are at intermediate frequencies.
Determining Autosomal Allele Frequencies
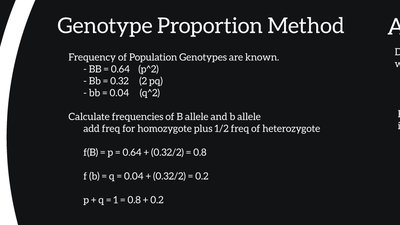
Genotype Proportion Method
If genotype frequencies are known, allele frequencies can be calculated by adding the frequency of the homozygote to half the frequency of the heterozygote:
f(B) = p = frequency of BB + 0.5 × frequency of Bb
f(b) = q = frequency of bb + 0.5 × frequency of Bb
p + q = 1
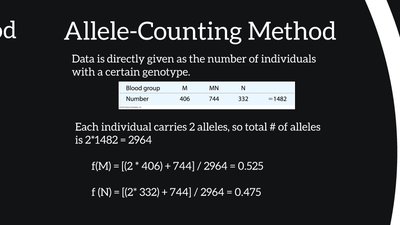
Allele-Counting Method
When the number of individuals with each genotype is known, allele frequencies are calculated by counting the total number of alleles:
Each individual has two alleles.
f(M) = (2 × number of MM + number of MN) / total number of alleles
f(N) = (2 × number of NN + number of MN) / total number of alleles
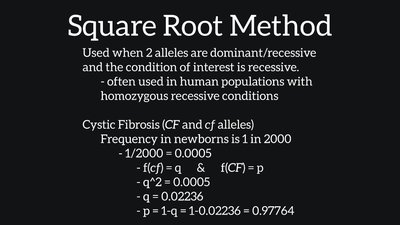
Square Root Method
This method is used when two alleles are dominant/recessive and the condition of interest is recessive. For example, in cystic fibrosis (CF), the frequency of affected newborns (homozygous recessive) is used to estimate allele frequencies:
q2 = frequency of affected individuals
q = square root of affected frequency
p = 1 - q
Application of Hardy-Weinberg Equilibrium
Sample Problems
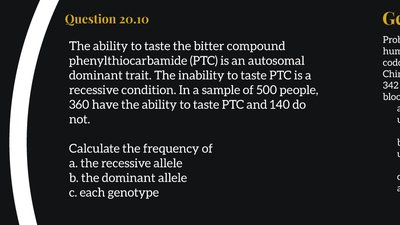
Example 1: The ability to taste PTC is an autosomal dominant trait. In a sample of 500 people, 360 can taste PTC and 140 cannot. Calculate:
a. Frequency of the recessive allele
b. Frequency of the dominant allele
c. Frequency of each genotype
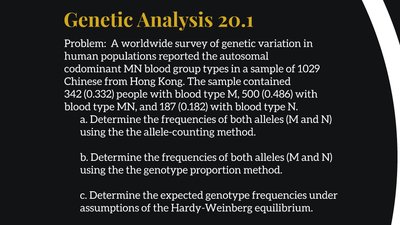
Example 2: In a sample of 1029 Chinese individuals, the MN blood group types are distributed as follows: 342 MN, 500 M, 187 N. Calculate allele frequencies using both the allele-counting and genotype proportion methods, and determine expected genotype frequencies under Hardy-Weinberg equilibrium.
Hardy-Weinberg Equilibrium for Three Alleles
Equilibrium Equations
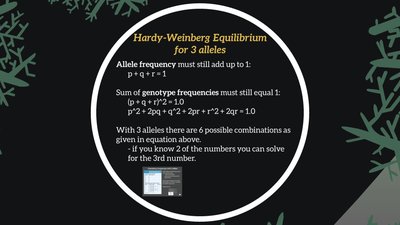
For three alleles (p, q, r):
Allele frequencies:
Genotype frequencies:
There are six possible genotype combinations. If two allele frequencies are known, the third can be calculated.
Calculating Frequencies with Three Alleles
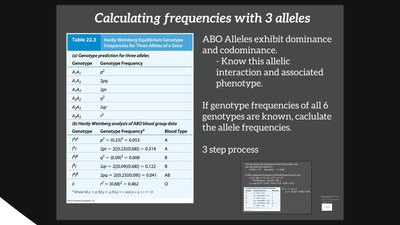
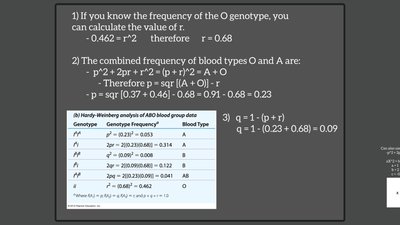
For example, in the ABO blood group system, alleles exhibit dominance and codominance. If genotype frequencies are known, allele frequencies can be calculated in three steps:
If the frequency of the O genotype is known, calculate r:
Calculate the combined frequency of blood types O and A to solve for p.
q = 1 - (p + r)
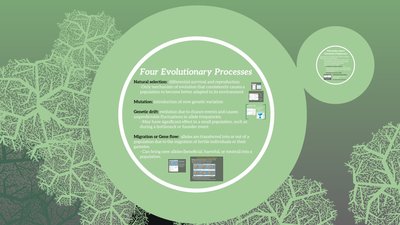
Four Evolutionary Processes
Overview
Four main evolutionary processes affect allele frequencies in populations:
Natural selection: Differential survival and reproduction; only mechanism that consistently causes populations to become better adapted to their environment.
Mutation: Introduction of new genetic variation.
Genetic drift: Random fluctuations in allele frequencies, especially significant in small populations.
Migration (Gene flow): Movement of alleles between populations, which can introduce new alleles and alter allele frequencies.
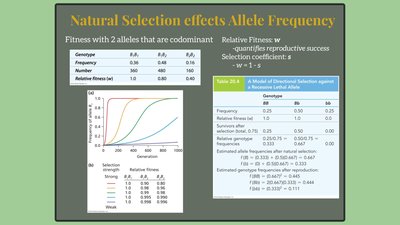
Natural Selection and Allele Frequency
Effects of Selection
Natural selection alters allele frequencies by favoring certain genotypes. The relative fitness (w) of a genotype quantifies its reproductive success, and the selection coefficient (s) is defined as .

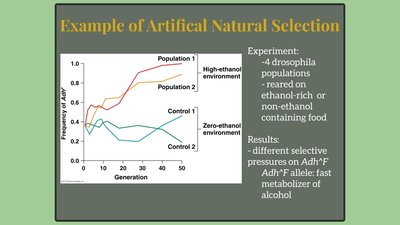
Example of Artificial Natural Selection
In an experiment with Drosophila populations reared on ethanol-rich or non-ethanol food, different selective pressures affected the frequency of the AdhF allele, which encodes a fast alcohol-metabolizing enzyme.
Genetic Drift
Random Fluctuations in Allele Frequency
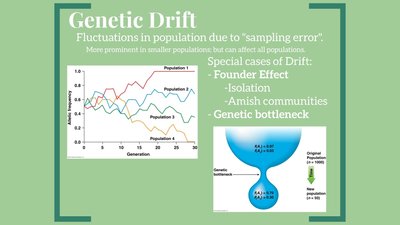
Genetic drift refers to random changes in allele frequencies due to sampling error, especially in small populations. Special cases include the founder effect, isolation, and genetic bottleneck.
Migration Effects on Allele Frequency
Gene Flow and Admixture
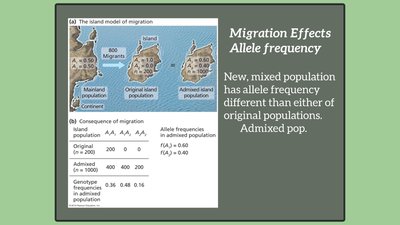
Migration introduces new alleles into a population, resulting in a mixed (admixed) population with allele frequencies different from the original populations.
Inbreeding and the Inbreeding Coefficient (F)
Calculating F
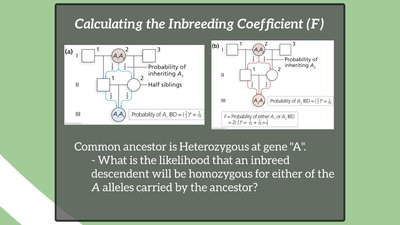
The inbreeding coefficient (F) measures the probability that an individual has two alleles at a locus that are identical by descent from a common ancestor. It is calculated using pedigree analysis and probabilities of inheriting alleles from ancestors.
Processes of Speciation
Biological Species Concept and Modes of Speciation
According to the Biological Species Concept (Ernst Mayr, 1942), reproductive isolation leads to the formation of new species. Speciation can occur via:
Allopatric speciation: Physical separation of populations.
Sympatric speciation: Populations share habitat but are isolated by genetic, behavioral, seasonal, or ecosystem-based mechanisms.
Additional info: These notes cover key concepts in population genetics, Hardy-Weinberg equilibrium, evolutionary processes, and speciation, providing a comprehensive overview suitable for exam preparation in a college genetics course.
