 Back
BackProbability Theory and Statistical Analysis in Mendelian Genetics
Study Guide - Smart Notes
 Tailored notes based on your materials, expanded with key definitions, examples, and context.
Probability Theory Predicts Mendelian Ratios
Introduction to Probability in Genetics
Probability theory is fundamental to predicting genetic outcomes, especially those described by Mendelian inheritance. Four principal rules guide these predictions: the product rule, sum rule, conditional probability, and binomial probability.
Product Rule: Used for independent events occurring simultaneously.
Sum Rule: Used for mutually exclusive events.
Conditional Probability: Applied when additional information modifies the probability calculation.
Binomial Probability: Used to predict the likelihood of a specific combination of outcomes in repeated events.
Definitions and Basic Formulas
Probability (P): The likelihood of an event occurring, defined as $P = \frac{a}{n}$, where a is the number of events of interest and n is the total number of possible events.
Product Rule (Multiplication Rule)
Application in Mendelian Genetics
The product rule is used to determine the probability of two independent genetic events occurring together.
Formula: $P = P_1 \times P_2$
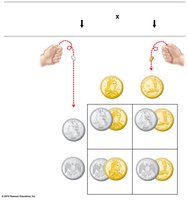
Example: In a Punnett square, the probability of an F2 plant displaying a recessive phenotype is calculated by multiplying the probabilities of inheriting each allele.
Sum Rule (Addition Rule)
Mutually Exclusive Events
The sum rule is used when calculating the probability of either one event or another occurring, but not both.
Formula: $P = P_1 + P_2$
Example: The probability of having 5 girls and 1 boy in 6 children is calculated by summing the probabilities of all possible arrangements.
Conditional Probability
Probability Modified by Prior Information
Conditional probability is used when the outcome of a genetic cross is known, and the probability of a specific genotype or phenotype is sought among those outcomes.
Example: In a Gg × Gg cross, the probability that a yellow-seeded progeny is heterozygous (Gg) is $\frac{2}{3}$, since only GG and Gg produce yellow seeds.
Binomial Probability
Predicting Series of Genetic Events
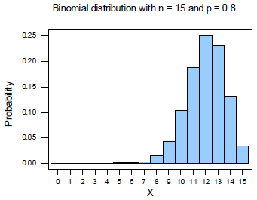
Binomial probability is used to predict the likelihood of a specific combination of outcomes in repeated events, such as the number of offspring with a particular phenotype.
Formula: $P = \frac{n!}{s!t!} p^s q^t$ Where n is the total number of events, s is the number of times event x occurs, t is the number of times event y occurs, p is the probability of event x, and q is the probability of event y.
Example: The probability of 5 girls and 1 boy in 6 children is $P = \frac{6!}{5!1!} (\frac{1}{2})^5 (\frac{1}{2})^1 = \frac{6}{64} = \frac{3}{32}$.

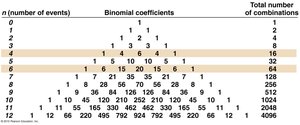
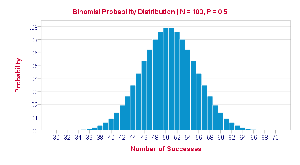
Binomial Expansion and Pascal's Triangle
The binomial expansion $(p+q)^n$ describes the probabilities of all possible combinations of outcomes. Pascal's triangle provides binomial coefficients for these calculations. 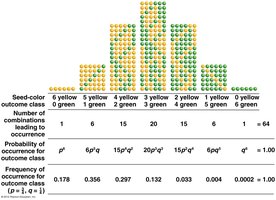
Application to Genotypes and Phenotypes
Calculating Probabilities for Multiple Outcomes
Example: For a Gg × Gg cross with 6 seeds per pod, the probability of each possible combination of yellow and green seeds can be calculated using binomial expansion and coefficients.
Normal Distribution and Chi-Square Tests
Statistical Significance in Genetic Experiments
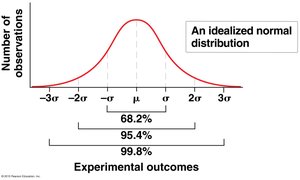
Genetic outcomes are probabilistic, and the normal distribution describes the expected variation in experimental results.
Normal Distribution: Most outcomes fall within one standard deviation ($\sigma$) of the mean ($\mu$). Results more than 2$\sigma$ from the mean are considered statistically significant (p-value < 0.05).
Chi-Square (χ²) Analysis
Evaluating Observed vs. Expected Outcomes
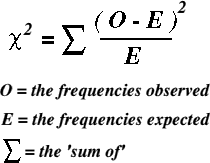
The chi-square test is used to determine whether observed genetic data significantly deviate from expected Mendelian ratios.
Formula: $\chi^2 = \sum \frac{(O - E)^2}{E}$ Where O is the observed frequency and E is the expected frequency.
Degrees of Freedom (df): $df = n - 1$, where n is the number of outcome classes.
Interpretation: Compare the calculated χ² value to a critical value in a chi-square table to determine statistical significance.
Example: Testing Mendel's Data
Predicted: For 7324 seeds, expect 5493 round and 1831 wrinkled.
Observed: 5474 round, 1850 wrinkled.
Calculation: $\chi^2 = \frac{(5474-5493)^2}{5493} + \frac{(1850-1831)^2}{1831} = 0.263$
Interpretation: p-value between 0.70 and 0.50; results are not significantly different from expectations.
Example: Significant Deviation
Observed: 3566 round, 3758 wrinkled.
Calculation: $\chi^2 = \frac{(3566-5493)^2}{5493} + \frac{(3758-1831)^2}{1831} = 2704$
Interpretation: p-value much less than 0.05; results are significantly different from expectations.
Summary Table: Binomial Probability and Chi-Square Analysis
Binomial Probability Table
Seed-color outcome class | Number of combinations | Probability | Frequency |
|---|---|---|---|
6 yellow, 0 green | 1 | $p^6$ | 0.178 |
5 yellow, 1 green | 6 | $6p^5q$ | 0.356 |
4 yellow, 2 green | 15 | $15p^4q^2$ | 0.297 |
3 yellow, 3 green | 20 | $20p^3q^3$ | 0.132 |
2 yellow, 4 green | 15 | $15p^2q^4$ | 0.033 |
1 yellow, 5 green | 6 | $6pq^5$ | 0.004 |
0 yellow, 6 green | 1 | $q^6$ | 0.0002 |
Pascal's Triangle Table
n (number of events) | Binomial coefficients | Total number of combinations |
|---|---|---|
1 | 1 1 | 2 |
2 | 1 2 1 | 4 |
3 | 1 3 3 1 | 8 |
4 | 1 4 6 4 1 | 16 |
5 | 1 5 10 10 5 1 | 32 |
6 | 1 6 15 20 15 6 1 | 64 |
Chi-Square Table
df | 0.95 | 0.05 | 0.01 |
|---|---|---|---|
1 | 0.004 | 3.84 | 6.64 |
2 | 0.103 | 5.99 | 9.21 |
3 | 0.352 | 7.81 | 11.34 |
4 | 0.711 | 9.49 | 13.28 |
Conclusion
Summary
Probability theory and statistical analysis are essential tools for predicting and evaluating genetic outcomes. The product, sum, conditional, and binomial probability rules allow for precise calculation of expected Mendelian ratios, while the chi-square test provides a method for assessing the significance of observed deviations from these expectations. Mastery of these concepts is fundamental for genetic analysis and interpretation.
