 Back
BackQuantitative Genetics: Additive Alleles and Polygenic Inheritance
Study Guide - Smart Notes
 Tailored notes based on your materials, expanded with key definitions, examples, and context.
Quantitative Genetics: Additive Alleles and Polygenic Inheritance
Introduction to Quantitative Genetics
Quantitative genetics is the study of traits that exhibit continuous variation, as opposed to discrete categories. These traits are typically influenced by multiple genes (polygenes) and often show a bell-shaped distribution in populations. Understanding quantitative genetics is essential for analyzing complex traits in both plants and animals, including humans.
Discontinuous (Mendelian) vs. Continuous (Quantitative) Traits
Definitions and Key Differences
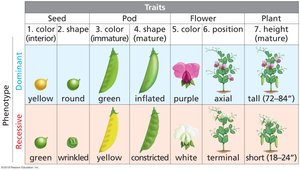
Discontinuous (Mendelian) Traits: Traits that fall into distinct categories, typically controlled by a single gene with clear dominant and recessive alleles (e.g., flower color in peas).
Continuous (Quantitative) Traits: Traits that vary along a spectrum and are usually influenced by multiple genes (e.g., height, weight, skin color).
Key Point: Discontinuous traits are easily classified, while continuous traits show a range of phenotypes due to the additive effects of several genes.
Examples: Discontinuous traits include pea color and shape; continuous traits include human height and wheat grain color.

Mendelian Traits in Pea Plants
Mendel's classic experiments focused on discontinuous traits, such as seed color and shape, pod color and shape, flower color and position, and plant height. Each trait was controlled by a single gene with dominant and recessive alleles.
Quantitative Genetics and Polygenic Traits
Definition and Importance
Quantitative genetics examines traits that are measured numerically and show continuous variation. Most traits of agricultural and medical importance, such as yield, growth rate, and blood pressure, are quantitative.
Polygenic Traits: Traits controlled by two or more genes, each contributing to the phenotype in an additive or cumulative manner.
Multifactorial (Complex) Traits: Traits influenced by both genetic and environmental factors.
Key Point: Polygenic traits are influenced by many genes, while multifactorial traits are influenced by both genes and the environment.
Polygenic Inheritance and Mendelian Rules
Multiple-Gene Hypothesis
The multiple-gene hypothesis states that many genes, each behaving in a Mendelian fashion, contribute cumulatively to a phenotype. This explains the continuous variation observed in polygenic traits.
Example: Grain color in wheat is determined by additive alleles at multiple loci.
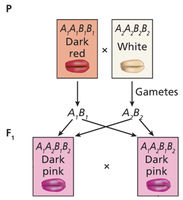
Additive and Nonadditive Alleles
Additive alleles contribute equally and independently to the phenotype, while nonadditive alleles do not contribute to the trait. The intensity of the phenotype increases with the number of additive alleles present.
In wheat, the more additive alleles present, the deeper the red color of the grain.
Incomplete dominance can also be observed, where heterozygotes show intermediate phenotypes.
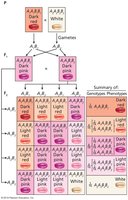
Gene Number and Phenotypic Variation
Relationship Between Gene Number and Phenotype Distribution
As the number of additive genes increases, the number of possible phenotypic categories also increases, resulting in a smoother, more continuous distribution of phenotypes. This is often visualized as a bell-shaped curve (normal distribution).
Each additive gene pair increases the number of phenotypic classes by two.
The equation for the number of phenotypic categories is: where is the number of gene pairs.
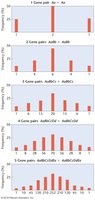
Estimating the Number of Polygenes
The number of polygenes contributing to a quantitative trait can be estimated by counting the number of distinct phenotypic categories and applying the formula:
Example: If there are 7 phenotypic categories, then polygenes.

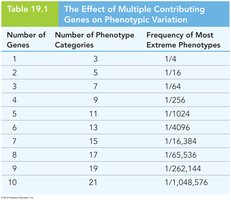
Table: Effect of Multiple Contributing Genes on Phenotypic Variation
The following table summarizes how increasing the number of genes affects the number of phenotypic categories and the frequency of the most extreme phenotypes:
Number of Genes | Number of Phenotype Categories | Frequency of Most Extreme Phenotypes |
|---|---|---|
1 | 3 | 1/4 |
2 | 5 | 1/16 |
3 | 7 | 1/64 |
4 | 9 | 1/256 |
5 | 11 | 1/1024 |
6 | 13 | 1/4096 |
7 | 15 | 1/16,384 |
8 | 17 | 1/65,536 |
9 | 19 | 1/262,144 |
10 | 21 | 1/1,048,576 |
Summary
Quantitative traits are controlled by multiple genes with additive effects, resulting in continuous phenotypic variation.
Polygenic traits still follow Mendelian inheritance at individual loci, but their combined effects produce a range of phenotypes.
The number of phenotypic categories increases with the number of contributing genes, and the distribution becomes more bell-shaped.
The formula allows estimation of the number of polygenes from observed phenotypic classes.
