 Back
BackQuantitative Genetics: Multifactorial and Complex Traits
Study Guide - Smart Notes
 Tailored notes based on your materials, expanded with key definitions, examples, and context.
Quantitative Genetics and Multifactorial Traits
Introduction to Quantitative Traits
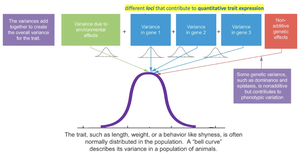
Quantitative traits are phenotypes that show continuous variation and are typically influenced by multiple genes (polygenic inheritance) and environmental factors. Unlike discrete traits, which are controlled by a single gene and exhibit distinct categories, quantitative traits such as height, weight, and behavioral tendencies display a range of values within a population.
Quantitative traits are also called multifactorial or complex traits.
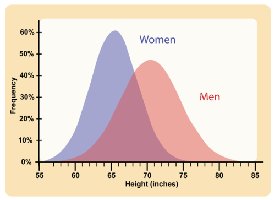
They are characterized by a normal distribution (bell-shaped curve) when measured across a population.
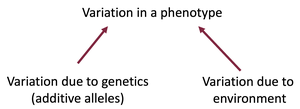
Both genetic and environmental factors contribute to the observed variation.
Genetic and Environmental Contributions to Quantitative Traits
Partitioning Phenotypic Variance
The total phenotypic variance (VP) observed in a quantitative trait can be partitioned into genetic variance (VG) and environmental variance (VE). This partitioning helps geneticists understand the relative contributions of heredity and environment to trait variation.
Genetic variance (VG): Variation due to genetic differences, including additive and non-additive effects.
Environmental variance (VE): Variation due to differences in environmental conditions.
Phenotypic variance (VP): The total observed variation in a trait.
The relationship is expressed as:
Discrete vs. Quantitative Traits
Discrete (Non-Continuous) Traits
Discrete traits are typically controlled by a single gene and exhibit clear, separate phenotypic categories. The genotype can often be inferred from the phenotype.
Example: Mendelian inheritance of flower color (purple vs. white).
Phenotypic ratios in offspring reveal underlying genotypes.
Quantitative (Continuous) Traits
Quantitative traits are controlled by multiple genes, each contributing a small effect, and are also influenced by the environment. The phenotype does not reveal the exact genotype due to the complexity of genetic and environmental interactions.
Example: Human height, corolla length in tobacco plants.
Distribution of phenotypes forms a continuous range.
The Multiple-Gene Hypothesis
Edward East’s Tobacco Experiment
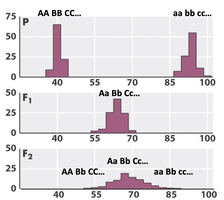
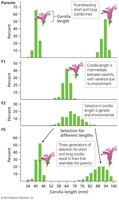
The multiple-gene hypothesis proposes that quantitative traits are controlled by several genes, each with an additive effect. Edward East’s classic experiment with tobacco plants demonstrated this principle.
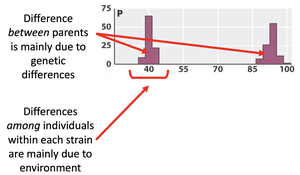
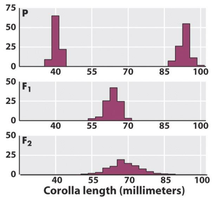
Parental lines (P) with short and long corolla lengths showed distinct phenotypes.
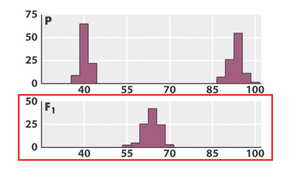
F1 generation had intermediate corolla lengths, indicating additive genetic effects and environmental influence.
F2 generation displayed a wide, continuous range of corolla lengths, reflecting both genetic recombination and environmental variation.
Selection over generations (F5) could recover the original parental phenotypes, supporting the role of multiple genes.
Genetic and Environmental Components of Quantitative Traits
Partitioning Variation in Parental and F1 Generations
In pure-breeding parental strains, differences between the strains are mainly due to genetic differences, while differences among individuals within each strain are primarily due to environmental effects. In the F1 generation, where all individuals are genetically identical, observed variation is almost entirely environmental.
Genetic and Environmental Variation in the F2 Generation
In the F2 generation, both genetic recombination and environmental factors contribute to the observed phenotypic variance, resulting in a broad, bell-shaped distribution.
Gene–Environment Interaction (G×E)
Definition and Effects
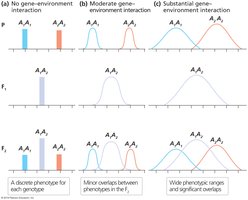
A gene–environment interaction occurs when the effect of a genotype on phenotype depends on the environment. The greater the interaction, the wider the range of possible phenotypes for a given genotype.
No interaction: Each genotype produces a distinct phenotype regardless of environment.
Moderate interaction: Some overlap in phenotypes among genotypes due to environmental effects.
Substantial interaction: Wide phenotypic ranges and significant overlap among genotypes.
Statistical Analysis of Polygenic Traits
Frequency Distributions and Normal Curves
Quantitative traits are analyzed using statistical methods. Measuring a large sample of individuals for a trait typically yields a normal (bell-shaped) distribution. The mean and variance are key statistical tools for describing the distribution of quantitative traits.
Mean (μ): The average value of the trait in the population.
Variance (σ2): A measure of how much the trait values spread around the mean.
Comparing Means and Variances
Populations can have the same mean but different variances, or different means and variances. The shape and spread of the distribution curve provide insights into the underlying genetic and environmental influences.
Population | Mean | Variance |
|---|---|---|
Red | Same as Green | Smaller |
Green | Same as Red | Larger |
Example: Two populations with the same mean but different variances will have distribution curves of different widths; a narrower curve indicates less variance, while a wider curve indicates more variance.
Summary
Quantitative traits are influenced by multiple genes and environmental factors.
Phenotypic variance can be partitioned into genetic and environmental components.
Gene–environment interactions can broaden the range of phenotypes.
Statistical tools such as mean and variance are essential for analyzing quantitative traits.
