 Back
BackQuantitative Genetics: Polygenic Inheritance, Heritability, and Artificial Selection
Study Guide - Smart Notes
 Tailored notes based on your materials, expanded with key definitions, examples, and context.
Quantitative Genetics and Polygenic Inheritance
Multiple-Gene (Multiple-Factor) Hypothesis
The multiple-gene hypothesis explains how many genes, each behaving in a Mendelian fashion, collectively influence a quantitative trait. These genes contribute additively to the phenotype, resulting in continuous variation rather than discrete categories.
Quantitative traits (e.g., grain color in wheat) are controlled by multiple genes, each with small, cumulative effects.
Each gene may have additive alleles (contributing to the trait) and nonadditive alleles (not contributing).
The more additive alleles present, the more intense the phenotype (e.g., deeper red grain color).
Polygenic inheritance produces a range of phenotypes, often forming a bell-shaped curve in populations.
Classic example: The 1:4:6:4:1 ratio in F2 generation for grain color in wheat, where each uppercase allele adds pigment.
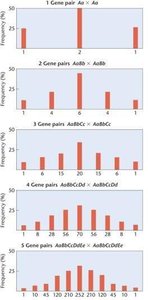
Example: Crossing two heterozygotes for polygenic traits results in a range of phenotypes, with the number of classes increasing as more gene pairs are involved.
Calculating the Number of Polygenes
The number of genes (polygenes) contributing to a quantitative trait can be estimated using phenotypic ratios in the F2 generation.
Formula for extremes: = proportion of F2 individuals expressing either extreme phenotype, where n is the number of gene pairs.
Formula for phenotypic classes: = number of distinct phenotypic categories observed.
Low numbers of polygenes produce fewer phenotypic classes; higher numbers produce more continuous variation.
Statistical Analysis of Quantitative Traits
Mean and Variance
Statistical measures are used to describe quantitative traits in populations.
Mean (\(\bar{x}\)): The arithmetic average, indicating the central tendency of the trait.
Formula:
Variance (s2): The average squared deviation from the mean, describing the spread of the data.
Distribution of Progeny
Quantitative traits, such as tomato weight, show a distribution of values in F1 and F2 generations, reflecting the underlying polygenic inheritance.
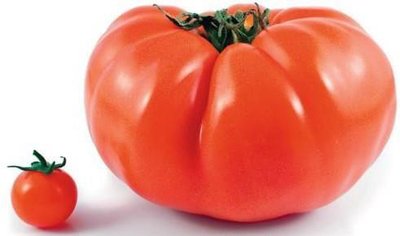
Example: Theoretical crosses in tomatoes demonstrate how selection and polygenic inheritance have led to the large size of modern varieties compared to their wild ancestors.
Heritability and Genetic Contribution to Phenotypic Variability
Heritability
Heritability estimates the proportion of phenotypic variation in a population that is due to genetic differences among individuals.
Broad-sense heritability (H2): Measures the total genetic contribution to phenotypic variance.
Formula:
Narrow-sense heritability (h2): Proportion of phenotypic variance due to additive genetic variance alone; more useful for predicting response to selection.
Example: A heritability value of 0.65 for human height means 65% of the variation is due to genetic differences.
Components of Phenotypic Variance
Phenotypic variance (VP) is partitioned into genetic and environmental components:
Genotypic variance (VG): Variation due to genetic differences.
Environmental variance (VE): Variation due to environmental factors.
Genotype-by-environment interaction variance: Variation due to interactions between genotype and environment.
Genotypic variance can be further divided into:
Additive variance (VA): Due to additive effects of alleles.
Dominance variance (VD): Due to dominance deviations in heterozygotes.
Interactive (epistatic) variance (VI): Due to interactions between loci.
Heritability Estimates for Traits in Different Organisms
Heritability values vary among traits and species, reflecting the relative importance of genetics versus environment.
Organism | Trait | Heritability (h2) % |
|---|---|---|
Mice | Tail length | 60 |
Mice | Body weight | 37 |
Mice | Litter size | 15 |
Chickens | Body weight | 50 |
Chickens | Egg production | 20 |
Chickens | Egg hatchability | 15 |
Cattle | Birth weight | 45 |
Cattle | Milk yield | 44 |
Cattle | Conception rate | 3 |
Artificial Selection and Realized Heritability
Artificial Selection
Artificial selection involves choosing individuals with preferred phenotypes for breeding, aiming to increase the frequency of desirable traits in future generations. This process is fundamental in agriculture and animal husbandry.
Traits under selection are often polygenic and multifactorial, making progress slower and more complex.
Examples include grain yield in plants, milk yield in cattle, and speed in horses.
Realized Heritability
Realized heritability is estimated from the response to selection and predicts the potential success of artificial selection programs.
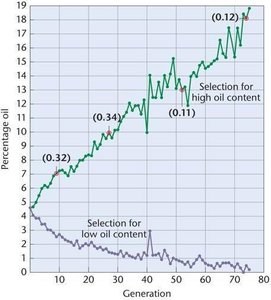
Example: Selection for high oil content in corn over 76 generations demonstrates the effectiveness of artificial selection and allows calculation of heritability at different points in the experiment.
Additional info: Quantitative genetics is essential for understanding the inheritance of complex traits and for improving economically important characteristics in agriculture and animal breeding.
